


By Nicolas Rabener, CAIA, CEO & Founder of Finomial.
SUMMARY
- Beta-neutral value, momentum, and low volatility factors are currently highly correlated to the S&P 500
- The correlation is temporary rather than structural
- Likely explained by the downturn in tech stocks that benefits these factors
INTRODUCTION
We recently published our quarterly Factor Olympics report (read Factor Olympics 2022) which highlighted the best year for factor investing in the last decade.
Aside from the usual rotation in factors, we also observed that some factors exhibited the same trends as the stock market in 2022. Given that the factors are constructed beta-neutral, this is rather unusual, which we explore in this article.
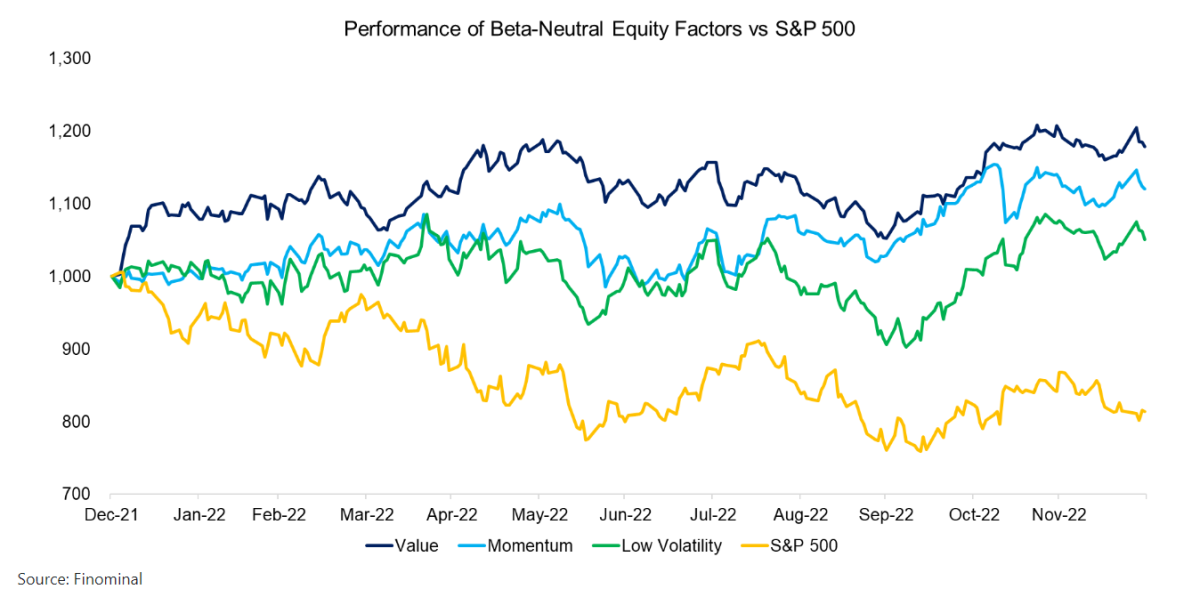
FACTOR PERFORMANCE 2022
In 2022, cheap stocks outperformed the stock market after almost a decade of underperformance. Given that this trend has established itself over more than 12 months, many value stocks have become momentum ones, which is highlighted by both factors exhibiting a similar performance in the last year. The low volatility factor also had a comparable performance as reflected in correlations of 0.71 to the value and 0.65 to the momentum factor.
However, more striking is that these three factors had the same trends in performance as the S&P 500. Each factor is constructed by taking the top and bottom 30% of all stocks in the US stock market ranked by their respective metrics, which results in a long and a short portfolio. These are rebalanced on a monthly basis and constructed beta-neutral so that the net beta of the long-short portfolio to the S&P 500 is zero. Given this, the returns are uncorrelated to those of the stock market (read Factor Construction: Beta vs $-Neutrality).
CORRELATION ANALYSIS
Calculating the rolling correlations of the value, momentum, and low volatility factors to the S&P 500 highlights essentially uncorrelated returns. We observe that none of the three factors exhibited correlations of larger than 0.5 to the stock market and that these were stable over time.
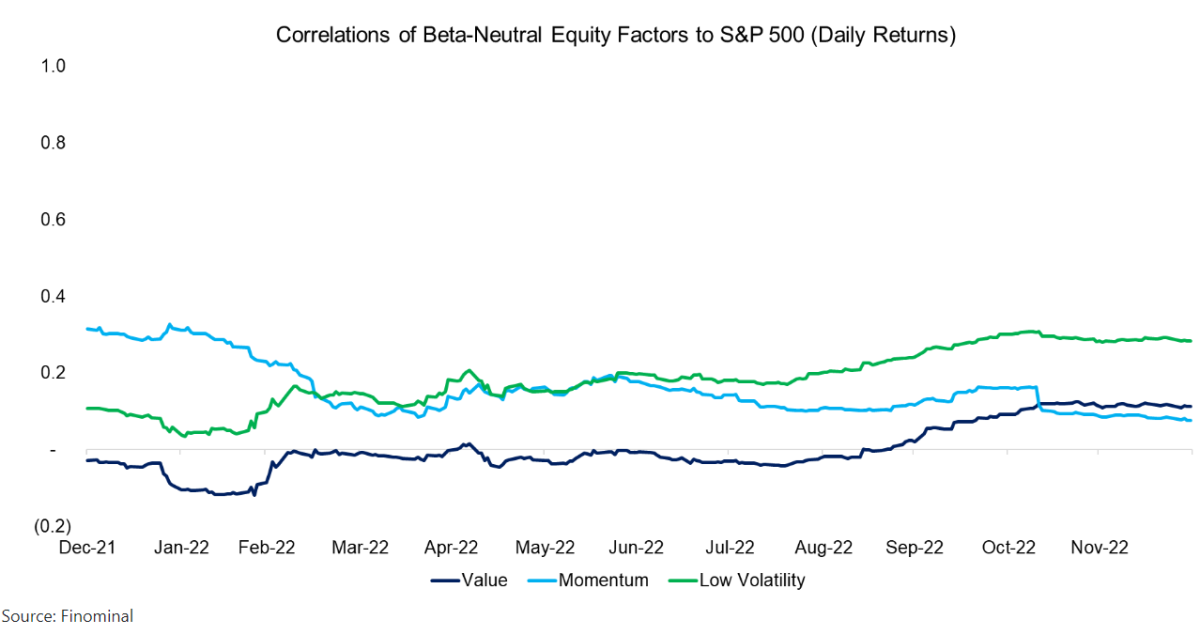
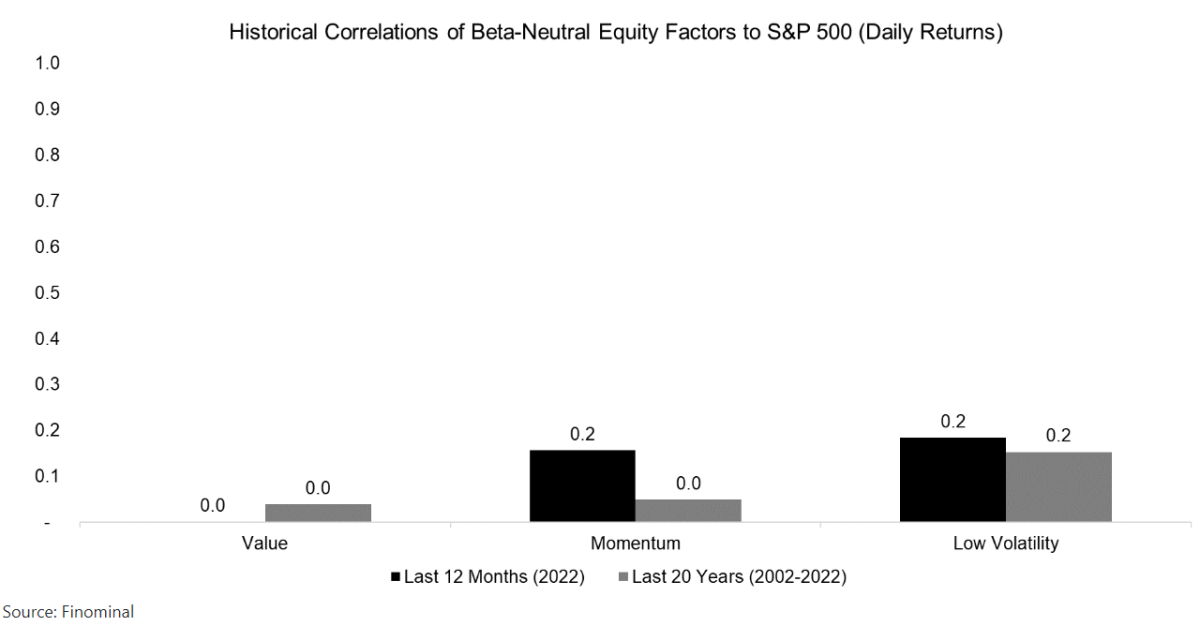
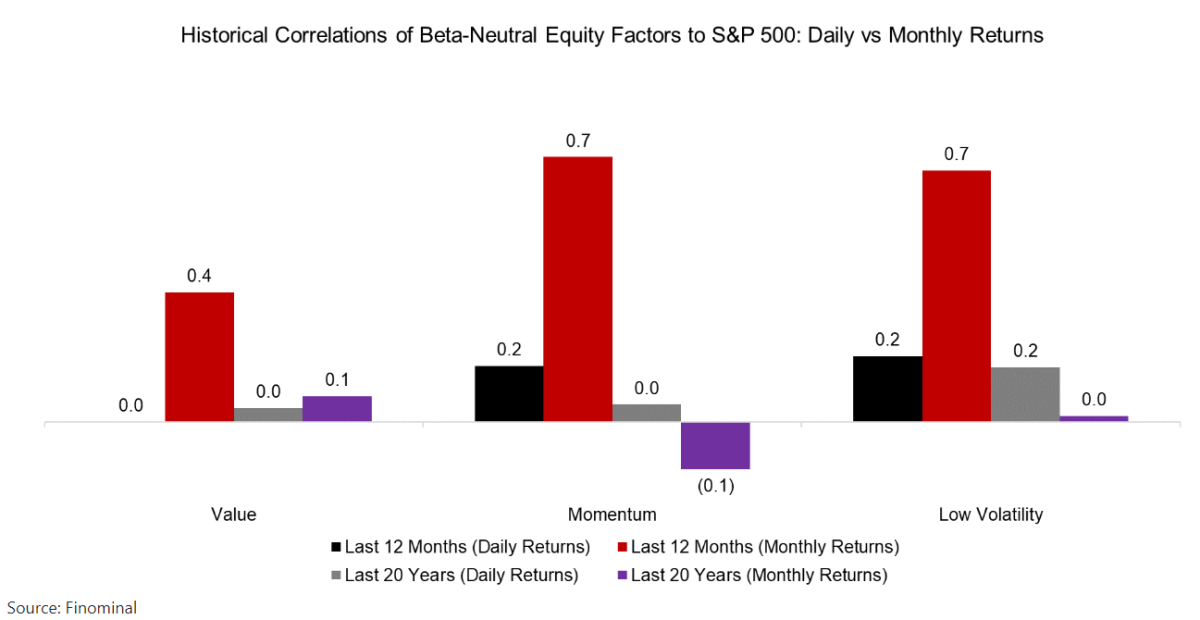
The average correlations of the three factors to the S&P 500 ranged between 0 and 0.2 in 2022, confirming the beta-neutrality of the portfolio construction. Furthermore, we can expand the lookback window from 12 months to 20 years, where we observe similarly low correlations.
Based on this data, it is difficult to explain why the returns over the last 12 months seem correlated.
MOVING FROM DAILY TO MONTHLY RETURNS
Daily stock prices can be considered noisy data and one way to reduce the noise is by moving from daily to monthly returns. We calculate the rolling correlations of the three factors to the S&P 500 using monthly returns which highlights correlations ranging from -0.6 to 0.7 in the period from 2003 to 2022.
Furthermore, we observe that over the last 12 months, these correlations have increased significantly. The momentum and low volatility factors have reached record-high correlations, while the value factor is only moderately correlated to the stock market.
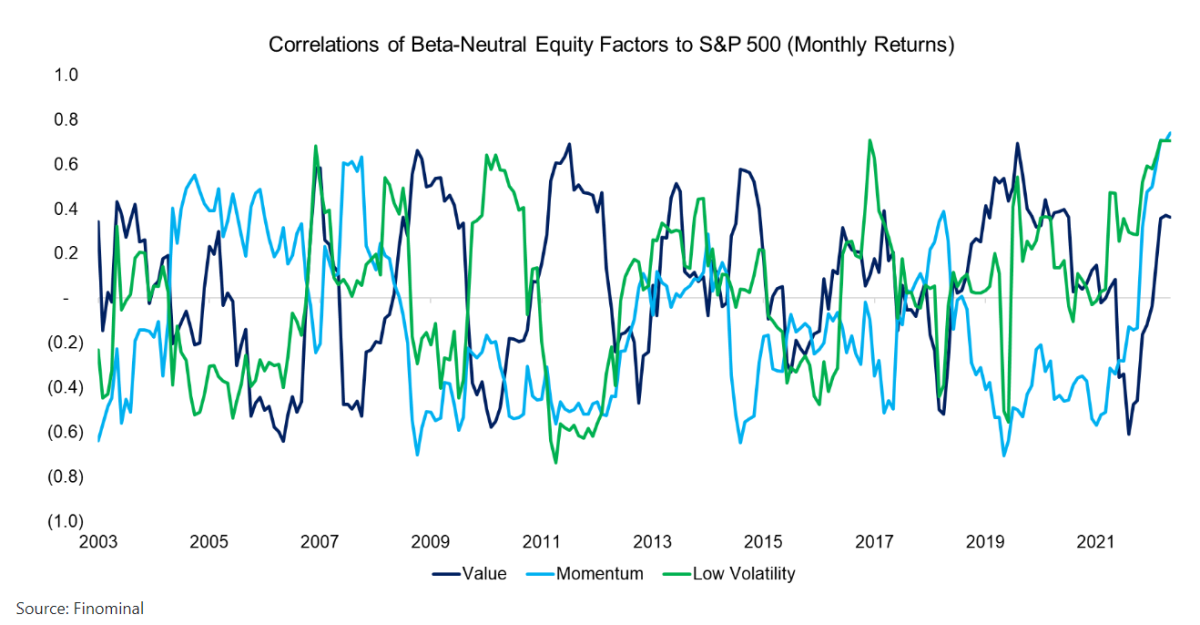
Using monthly rather than daily returns for calculating correlations creates a vastly different perspective, although this has had a larger impact for the last 12 months than for the previous last 20 years.
Over the short term, factors were highly correlated to the stock market, but over the long term, they were not. The same can be said about bonds as these were uncorrelated to stocks over the last few decades, but not over the last year, to the detriment of the traditional 60/40 portfolio.
FURTHER THOUGHTS
Although it is relatively easy to measure the increase in correlations of value, momentum, and low volatility factors to the S&P 500, it is not so easy explaining this trend as the returns should be uncorrelated given beta-neutral portfolio construction.
Perhaps these common trends simply reflect the downturn in growth stocks as these tend to be expensive and highly volatile, and their declines benefited the value and low volatility factors. The momentum factor simply selects the winning stocks, regardless of their characteristics.
Rising correlations within a portfolio are always concerning, but the high correlations of the three factors to the S&P 500 are temporary rather than structural. Important for investors is to measure and monitor their factor exposure, eg via Finominal’s Know Your Factors tool.
More research from Finomial is here.
About the Author:
Nicolas Rabener is the founder & CEO of Finomial (formerly FactorResearch) and previously founded Jackdaw Capital, an award-winning quantitative hedge fund. Before that Nicolas worked at GIC and Citigroup. Nicolas holds an MSc from HHL Leipzig Graduate School of Management, is a CAIA charter holder, and enjoys endurance sports (100km Ultramarathon).
