

By Joachim Klement, Head of Strategy, Accounting, and Sustainability at Liberum Capital.
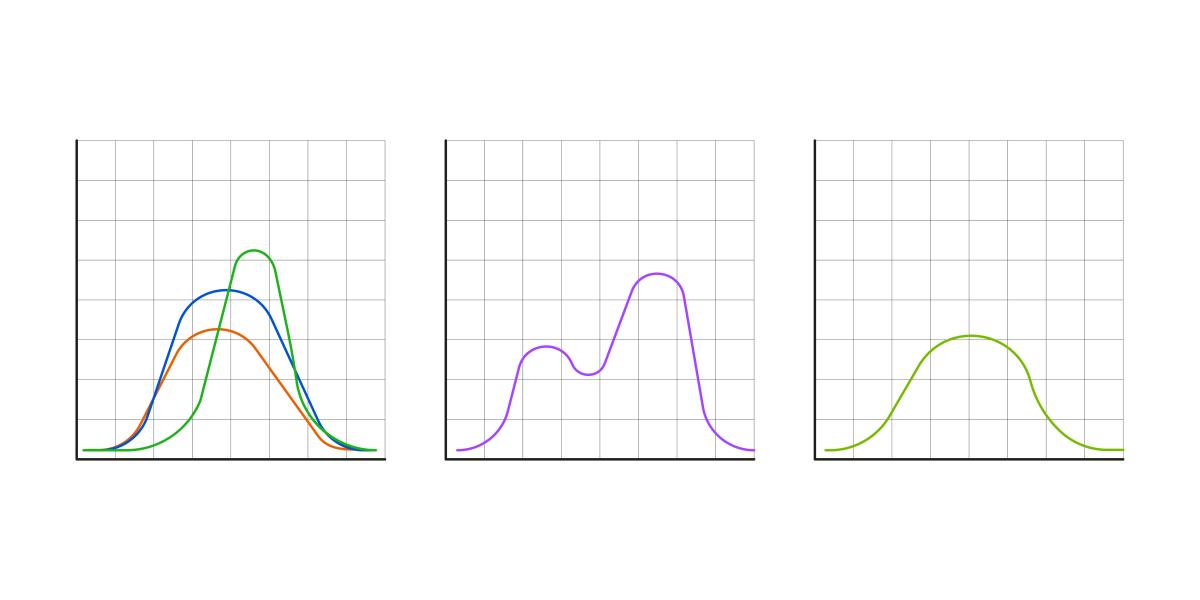
We all know that stock market returns are not normally distributed. Instead, we think of them as having fat tails (i.e. extreme events happen more frequently than expected). But if you look at the distribution of stock market returns over different time frames then you will find that returns aren’t even monomodal, i.e. they don’t just have one peak in the middle of the distribution as predicted by the normal distribution. Instead, it is easy to identify different market regimes in the return distribution.
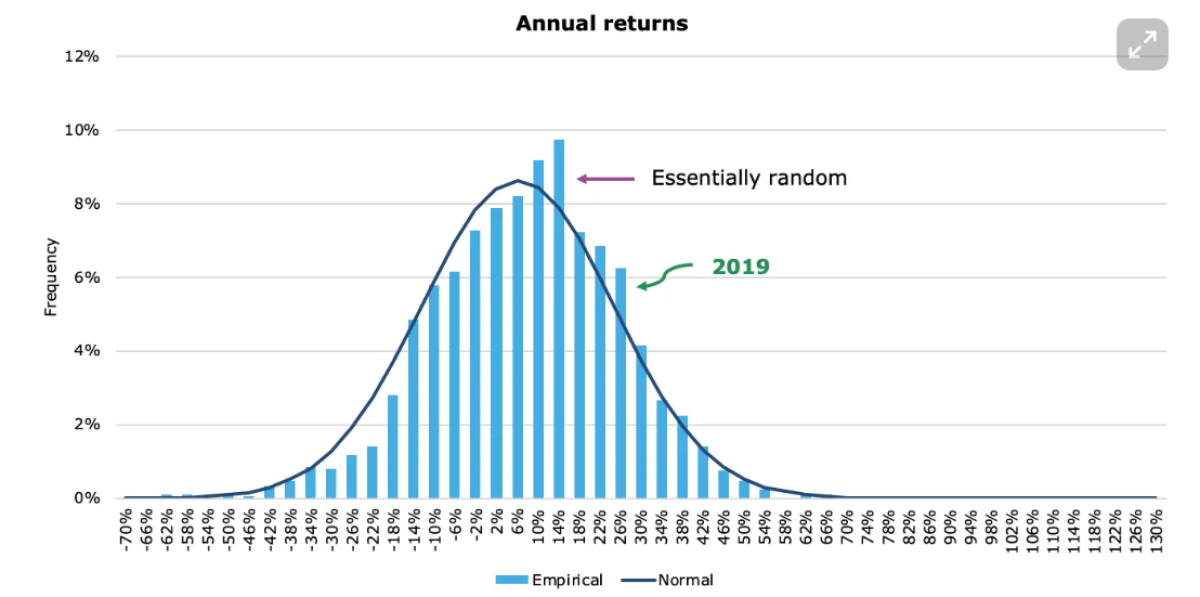
Let’s first look at the annual returns of the S&P 500 index. I have plotted the price returns of the S&P 500 since 1871 together with the expected normal distribution of returns. The data is from Prof. Robert Shiller’s homepage. As you can see, on an annual scale, market returns are essentially random and follow the normal distribution relatively well. Put in this context, the year 2019 was one of the better years in the history of the S&P 500 but not an extreme year.
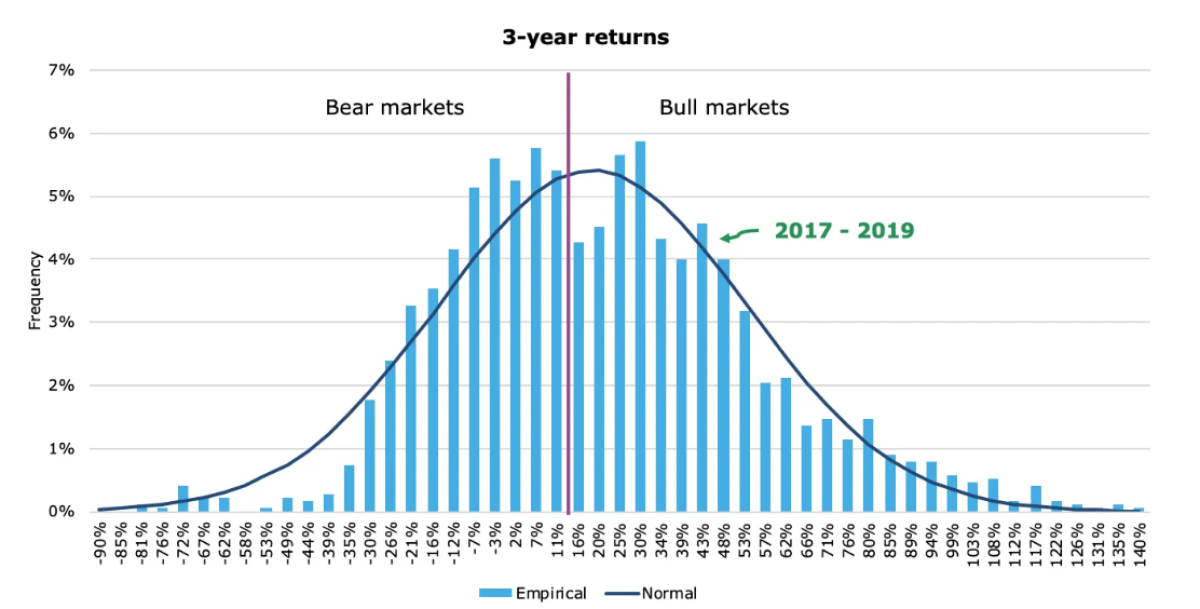
If we look at rolling 3-year returns, we can see that the distribution of market returns become bimodal. There is a first peak for cumulative 3-year returns of about 0% and a second peak for cumulative 3-year returns of about 30%. The first peak corresponds to bear market environments when 3-year market returns become essentially negative. The second peak corresponds to bull market environments where markets rise uninterrupted for three years in a row. As we can see, the last three years have delivered returns that are essentially in line with what can expect in a bull market environment.
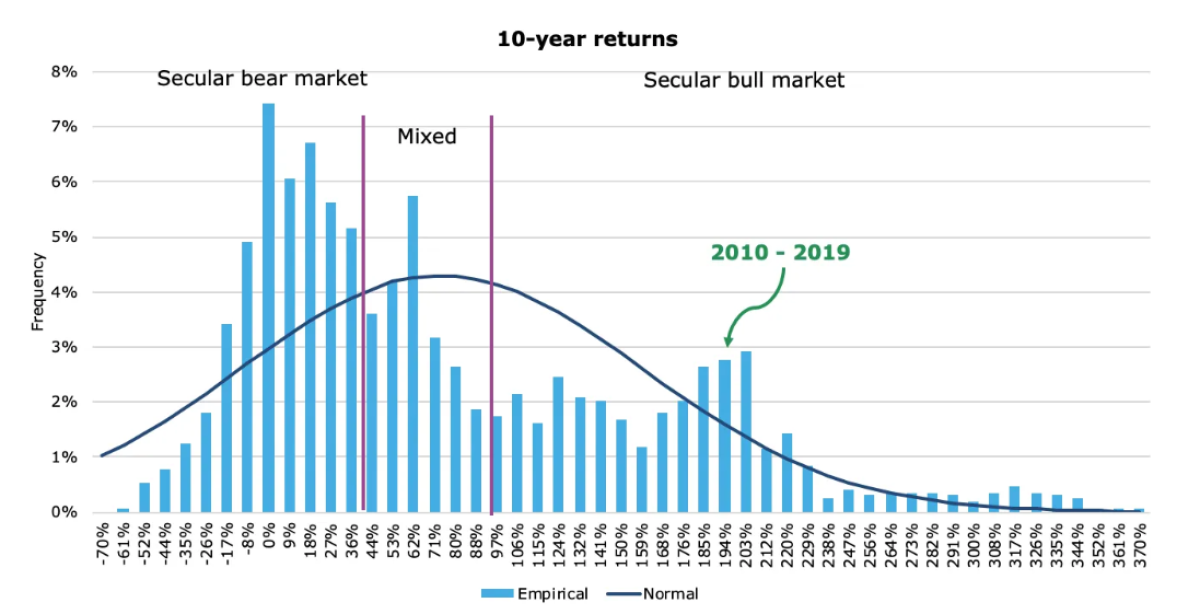
Finally, if one expands the time horizon to 10 years, the distribution of returns becomes trimodal, i.e. it starts to have three peaks. The first peak corresponds to decades that are in a secular bear market like the 1970s or the first decade of the 21stcentury. Investors who live through such a secular bear market have little to show for their investments at the end of the decade with a typical cumulative return in the single digits after ten years. Then there is a second peak, which corresponds to 10-year periods when investors experience both a secular bear and a secular bull market (or parts thereof). For some years, returns are abysmal, for others they are great. At the end of the 10-year period, cumulative market returns are somewhere in the 60% to 80% range or about 5% to 6% per year. Not great, but at least better than inflation. And then there is the third peak on the right side of the chart below, which corresponds to a secular bull market where markets rise practically without any interruption from nasty bear markets for a decade. As we can see, the last decade has been a typical secular bull market and not out of the ordinary at all. However, we need to be aware that while the last decade was a run of the mill secular bull market, this also means that the next decade will likely be a mixed period where we experience the tail end of the current secular bull market and the front end of the next secular bear market. Why? Because there has not been a single secular bull market in history that has lasted for two full decades. We know that the current bull market is already the longest bull market in history so it is only reasonable to assume that it will end sometime in the next decade. And then, we should expect that market returns move into the mixed zone of mediocre returns.
All posts are the opinion of the contributing author. As such, they should not be construed as investment advice, nor do the opinions expressed necessarily reflect the views of CAIA Association or the author’s employer.
About the Author:
Joachim Klement is an investment strategist based in London working at Liberum Capital. Throughout his professional career, Joachim focused on asset allocation, economics, equities and alternative investments. But no matter the focus, he always looked at markets with the lens of a trained physicist who became obsessed with the human side of financial markets.
Joachim studied mathematics and physics at the Swiss Federal Institute of Technology (ETH) in Zurich, Switzerland and graduated with a master’s degree in mathematics. During his time at ETH, Joachim experienced the technology bubble of the late 1990s firsthand through his work at internet job exchange board Telejob.
Through this work, he became interested in finance and investments and studied business administration at the Universities of Zurich and Hagen, Germany, graduating with a master’s degree in economics and finance and switching into the financial services industry in time for the run-up to the financial crisis.
During his career in the financial services industry, Joachim worked as investment strategist in a Swiss private bank and as Chief Investment Officer for Wellershoff & Partners, an independent consulting company for family offices and institutional investors as well as Head of Investment Research for Fidante Partners.
