


By Thomas Meyer, Managing Director of SimCorp Luxembourg s.a.r.l. (part of Deutsche Börse Group).
Standard risk assessments meet their limits when applied to private assets. The extreme uncertainty inherent in private markets requires scenario analysis and in particular stress testing to unearth the risks that may not be apparent, due to poor quality of and gaps in data. Stress testing involves subjecting a portfolio to extreme scenarios to identify and understand vulnerabilities, dependencies, and concentrations that could lead to significant losses.
The organized market for private capital is dominated by funds as principal financial intermediaries. These funds are typically structured as closed-ended limited partnerships, with limited partners (LPs) as investors, and are cash-flow assets – which we would describe, in the absence of a common definition, as assets that during some market periods cannot be traded at fair prices, need to be sustained through a timely provision of liquidity and are characterized by their cash-flow streams of uncertain amounts and at unpredictable times. When LPs commit to a private capital fund, the committed capital is not needed at once but will be called once an investment is identified.
The Importance of Stress Testing
‘Stress’ is usually associated with adverse events, but generally it is a tool for sensitivity analysis, that allows evaluating the impact of assumptions and explaining the associated market risks and opportunities. Scenario analysis considers expert opinion and works even when there are no statistical observations for inferring valid likelihoods. The levels of stresses that are applied reflect the degree of uncertainty LPs are faced with.
The purpose of stress scenarios is not coming up with unrealistically conservative assumptions with catastrophic effects on the investment strategy that would render the exercise meaningless anyway, but rather to test impact of changes in input parameters. Replaying previous downturns in financial markets are a particularly effective tool for assessing the impact of emerging crises. The results can be surprising as they often suggest that the sky will not come crushing down; particularly for portfolios of private capital funds such replays rather add a long-term perspective and help investors in avoiding over-reactions – like stopping commitments to new funds or even selling off interests in funds to the secondary market – that are likely to destroy value.
The Rhyming of History
LPs will be particularly concerned about the impact of a potential ‘Black Swan’ that could mess up all their assessments. Such events come as surprise, making them exceedingly rare from a probabilistic standpoint, and are feared to fundamentally alter the private market landscape. For stress scenarios it is instructive to look at past market crises with comparable impact.
Market Crises
Referring, among others, to the Asian Financial Crisis (1997–1998), and the Global Financial Crisis (GFC, 2007–2008) as examples, Reinhart and Rogoff (2009) describe the ‘this-time-is-different syndrome’, referring to the unrealistic optimism that afflicts investors and policy makers before such bubbles finally burst.

Usually, the unrealistic optimism turns quickly into a pessimism that, at least as far as private capital funds are concerned, seems to be equally misplaced. Regarding the financial returns these crises and other ‘Black Swans’, like the dot-com crash, apparently had no discernible impact on outcome ranges (see Figure 1).
For funds that were raised during a crisis average return in most cases did not go down, sometimes they even went up. This should be expected, as because of LPs holding back fewer funds come to the market, they close later, and subsequently face less competition and better opportunities.
Vintages of funds being raised three to four years before a crisis should be exposed to it most, as their investments in private assets will be at their peak. However, also here no clear pattern emerges. Even if there is a downward pressure on the NAVs there is also sufficient time (more than five years) for the funds to mature, the market to recover, and the fund managers finding a better exit window.
NAVs of funds close to maturity with exits scheduled already should be strongly affected by a market downturn, but on the other hand, the bulk of their private assets will already have been realized and little of their portfolio remains that could materially change the fund’s TVPI on maturity.

From 1960 to 2020, the S&P 500 seven times dropped more than 30%[1], i.e., on average every 8,6 years. Historically, next to every fund in its on average 10-year lifetime was exposed to at least two US presidential elections, recessions, wars, acts of terrorism, epidemic outbreaks – in other words to at least one and sometimes more ‘Black Swans’ (see Figure 2). The set-up of funds with their long lifetimes and the uncalled capital underwritten by deep-pocketed LPs has evolved to withstand such events[2].
Interest Rates and Inflationary Periods
Similar observations apply to other economic stress scenarios. Barrington et al. (2009) analysed fund performance data since 1986 and found no correlation between inflation and returns for LBO funds. In line with the recommendations of the previously mentioned research reports these authors’ conclusion regarding the attractiveness of the environment at the time remained unchanged – in their assessment the late 2000s felt remarkably similar to the early 1990s and 2000s when the LBO funds of those vintages went on to produce outstanding returns.
Modelling Crises
As far as we can rely on private market statistics there is little impact of crises on the fund’s performance outcomes over the long-term, at least on the portfolio level. The immediate impact of depressed markets is on valuations.
Valuation Impact
Investment boards become concerned about risks. Under these circumstances some LPs try to sell off stakes in funds on the secondary market, and secondaries become attractive for buyers. While is reaction is understandable, there could be no worse time than during a large market decline – ‘exactly when one would want to put committed capital to work’[3]. Other LPs get concerned about the denominator effect and aggressively write down the private assets valuations to avoid the need of selling them off[ii].
According to Gottschalg (2020), two observations during the GFC stand out: firstly, the shortfall in NAV amounted to only 4% relative to the forecasted NAV. Secondly, this impact was relatively short term in nature. In fact, the 2012 figures showed that the same sample of funds had caught up and that their investment returns were well beyond what was predicted for 2009. The funds experienced a longer J-curve but that on aggregate they eventually moved back into positive performance territory.
Delay of New Commitments
During the GFC many LPs feared to become cash constrained as pensions and allowances needed to be paid whereas there were the remaining commitments supposed to be called by the fund managers[4]. Under these circumstances and in response to the unanticipated liquidity shock many LPs delayed new commitments. Unsurprisingly there was not only a slowdown in commitments to new funds but fund holding periods became longer as well.
Changes in Contribution Rates
Capital calls as well as realizations tend to decline during market downturns as not only LPs but investors in general become stricter regarding their due diligence and potential sellers more reluctant to transact at close to bottom prices. During the dot-com bubble venture capitalists invested large amounts into Internet companies.
When investors began questioning the viability of this sector the bubble finally deflated and few new investments were undertaken, as evidenced by the sharp decline in contribution rates. The GFC showed a similar pattern. In its beginning, LPs were suffering declines in value of their liquid assets and struggling to meet capital called from the private equity funds. In this situation large institutional investors like CalPERS were even reported to have asked fund managers to delay capital calls[5]. Also some firms themselves reduced the size of their funds or made fewer capital calls[6].
Schneider et al. (2022) analysed Preqin data (mainly North America) from 1992 to 2020, incorporating funds with at least five years of data, and found evidence for timing and sizing of capital calls being correlated with financial market movements. For private equity and private debt capital call rates the authors found a slightly positive relationship to public market returns (a 0.33 correlation for debt and 0.46 for equity).
This pattern apparently changes, however, as crises are prolonging. Contributions rise again, often significantly, for various reasons. Fund managers try to support their remaining promising investments. Because it is difficult to access external funding under depressed market conditions, the ‘dry powder’ of remaining commitments becomes the main source of financing. Thus, with two to three years of delay, capital calls tend to accelerate and catch-up with the historical contribution rates.
Post-Covid-19 Murphy et al. (2022) reported that at a time when the crisis abated, a historically very high 40% of dry powder was in funds that were 2-5 years old, i.e., funds that were approaching the end of their investment period. The need to put capital at work quickly could have negative implications: pressured buyers focus at spending equity, thus paying higher multiples, reducing leverage, and syndicating less[7]. On the other hand, as the market is recovering fund manager may be well placed to acquire private assets at more attractive valuations. Fund with adequate liquidity during down markets were found to harvest a significant return premium[8]. The pick-up in contributions later in these crises is consistent with these observations.
Changes in Distributions
During the GFC an illustrative portfolio of private equity funds showed a contraction of distributions by 65% while contributions decreased by 20% relative to the forecasts under normal market conditions[9].
This is a development to be expected during a market crisis where valuations for all assets are collapsing, but in 2012 this impact was just over a relatively short term. Here the same sample of private equity funds had caught up and its cash-returns as well as its overall performance was well beyond what was feared in 2009[10]. Exits are also affected by the interest rate environment, particularly for the largest transactions that often rely on public listings.[11]
In crises, there is a shortfall in cash distributions, but also the contributions usually come to a standstill, so that the net cash-flow impact is relatively mild. However, there are caveats. For mature funds realizations will decrease significantly. This decline is not offset by the slowdown in capital calls, so in this case the net impact will be negative[12]. Portfolios comprising mainly young funds in ramp-up mode may experience lower than usual net cash-flows.
Cash-flows patterns also change over time, e.g., the downside scenarios observed during the GFC did not materialize during the Covid-19 crisis, where it looked quite different. Here some portfolios even gained – with a kind of ‘M&A boom’ in various sectors like food delivery and online mail order – while notably travel and leisure were hit hard.
Lessons
A key lesson from the GFC period is the need for a consistent approach to committing[13]. As one representative from a pension fund observed in a roundtable discussion, in hindsight, institutional investors in private equity funds should have committed more in 2009/2010. There was little funding available at that moment, so if LPs were seeking access to funds and strategies they would have found very few funds were able to facilitate an orderly close. When the investment pace rebounded just after the crisis the vintage year 2010 turned out very well. This anecdotal evidence suggests that LPs should not overreact to relatively short-term market developments.
Market Replay
For analysts who want to flex their assumptions, the first question is what market environment will the portfolio be exposed to? Past is not future, so to what degree are past performance outcomes indicative for the scenarios that should be addressed?
Any crisis features close similarities to earlier ones, which suggests that replaying them on the LP’s current portfolio structure, with its different exposures to strategies, geographies, sectors, and fund ages, be a powerful way of understanding its vulnerabilities. There are many market factors that came into play during a historic period that are not all known and understood. Using private market data that was influenced by these periods can recreate these market conditions.
Such a replay connects with decision makers as such scenarios will not appear to be farfetched and unrealistic. What happened in the past, while not being a perfect indicator for the future, provides insights into how a portfolio may react to similar events should they repeat in the future.
Not every crisis is a repeat of a previous one and can be explained by a replay story. It may be controversial and even result in complacency (‘this clearly never happened’) but is the situation really comparable? The comparison is clearly imperfect, and we do not even know all factors that had mattered. One way of stressing this additionally is simulating longer periods where conditions of historical crises continue to hold. Also, it makes sense to define hypothetical scenarios and assess the impact of multiple variables in combination to show the range of outcomes that could occur.
During market downturns investors get worried that the reported valuations – for instance, due to delays – do not reflect the true situation. The LP would like to put stresses on current valuations and, implicitly and probably more relevant, performance outcomes. An obvious sensitivity analysis to apply is changing the fund’s forecasted TVPIs on maturity upwards or downwards.
Stressing Cash-Flows
The second, and arguably more important[14], question for analysts is how are cash-flow patterns affected by market changes and what impact does this have on the portfolio’s liquidity?
Important stresses relate to changing fund lifetimes, front-loading and back-loading of cash-flows, and changes in frequency and volatility of cash-flows[15].
Extending and Shortening of Fund Lifetimes
While fund’s have contractual lifetimes, the reality is often quite different, a reason why assessing the impact of changes in lifetimes is an important part of a sensitivity analysis[16]. A typical stress would be increasing a fund’s projected lifetime while maintaining its projected TVPI. This results in a lower IRR, as distributions will be spread over longer time periods.
Doimi de Frankopan (2009) suggested as a possible response of private equity longer holding periods during deflation, as exits become more difficult. During inflation there would be a flight to investments that have a much quicker turnaround. Also, the opportunity costs and risks related to the undrawn commitments are likely to be higher during inflationary periods.

The fund’s cash-flow scenario is a series of cash-flows:
A cash-flow scenario comprises either contributions or distributions. Figure 3 shows two strategies for allocating cash-flows to different lifetime. If several cash-flows are allocated to the same period, they are added and therefore the size of the cash-flow in the new period can increase. When shifting, one cash-flow from one previous period is mapped to one new period. When stretching, one cash-flow related to one previous period can be split into different cash-flows (according to the number of periods it is mapped to). The size of the cash-flows changes in proportion to the relationship between old and new (remaining) lifetime.

Stretching comes in most cases with a decline in volatility. Shifting therefore is more consistent with a stress as the cash-flows volatility is preserved. The extension or shortening of a fund’s lifetime would come with a proportional stretching and compression of the fund’s cash-flow pattern. Figure 4 depicts the situation where a fund’s lifetime is extended with its distributions shifted backward.
Front-Loading and Back-Loading of Cash-Flows
A variation on this play is a sensitivity analysis where the fund’s lifetime as well as its TVPI is kept unchanged, but where within the assumed lifetime cash-flows are accelerated or decelerated[17].

Typical stress scenarios are front-loading with positive stress factor (see Figure 5) of contributions compared to a normal schedule, back-loading with negative stress factor (see Figure 6) of the fund’s distributions, or combinations of both, as both these stresses imply less liquidity for the LP[18].

When the investment environment is unfavourable, investment opportunities are likely more difficult to come by and therefore contribution rates will be lower than under normal conditions.
With front-loading and back-loading cash-flows are ‘squeezed’ into shorter time intervals. Combining the front-loading of contributions with back-loading of distributions results in a lower IRR for the fund. The back-loading of contributions together with front-loading distributions has the opposite effect.
Increasing and decreasing frequency of cash-flows
Variations caused by changes in frequency and volatility of cash-flows are critical for liquidity risk management.
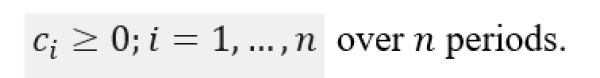
Let m be the number of non-zero cash-flows during the scenario's n periods. For the purpose of the sensitivity analysis, the frequency 0 < f < 1 of this cash-flow scenario is defined as:
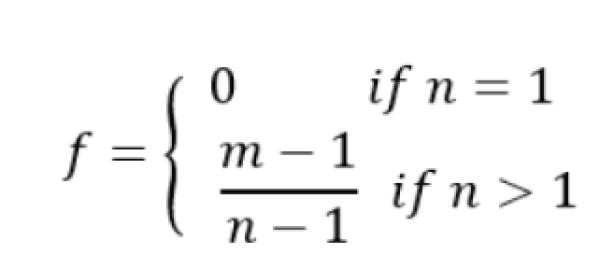
For this frequency there are two extremes: one non-zero cash-flow for each period, giving the maximum frequency f=1 and just one cash-flow of maximum size Cmax =


Assuming that changes in frequency have to maintain the fund's targeted lifetime and TVPI20, for f=0 and for distributions the only remaining cash-flow is allocated to the last period. In case of contributions this cash-flow is allocated to the first period; both treatments are consistent with a pessimistic scenario.
Unlike in the previous cash-flow related stresses there is no unique solution to changes of f. The base scenario described in Figure 7 is three cash-flows over eight periods, implying f = 0.28. Increasing f = 0.50 requires an m of between four and five periods. Assuming five periods, we then need to randomly split the existing three cash-flows and assign part of these splits to two randomly chosen periods without a cash flow.
Decreasing the frequency requires to randomly select cash-flows from the base scenario and individually adding them to one of the following, again randomly chosen periods. If we reduce the frequency to zero, the m would be 1, meaning that we need to remove the other two of the three cash-flows and assign them to the last remaining one.
The randomness inherent in picking cash-flows, splitting them, and assigning them to remaining cash-flows (when frequency is decreased) or empty periods (when it is increased) requires various choices. For decreasing as well as increasing the frequencies of cash-flows various policies are meaningful. For example, basing the decisions how much to allocate to which period on a skewed PDF would allow making the allocation of cash-flows to periods closer to the fund’s end of lifetime more likely. This illustrates that changing the frequency of a fund’s cash-flows requires several assumptions and is more complex to implement than the other stresses discussed so far. Similar complexities apply to changing the volatility of a fund’s cash-flows.
Increasing and Decreasing Volatility of Cash-Flows
Past crises suggest a slowdown of capital calls but there were also situations where LPs with more capital calls during down turns[21]. A higher volatility of cash-flows may be a better model for this situation[22]. If the average projected timing of both is kept constant, lumpier (i.e., lower frequency or higher volatility) capital calls and realizations put more pressure on liquidity resources than more smoothly distributed ones[23].
For the purpose of the sensitivity analysis the volatility:

of a fund's cash-flow scenario over n periods is defined as the difference between the fund's smallest and largest cash-flow24. Two extremes need to be considered: for the minimum volatility v=0 all cash-flows are of an equal amount. For the maximum volatility v= 1 there is just one cash-flow of size:


For achieving v=0 there are at least two possible approaches. One aims to keep the frequency of cash-flows unchanged, implicitly assuming that volatility is only measured for the non-zero cash-flows. The other approach would be to spread all cash-flows evenly over all the cash-flow scenario’s periods (see Figure 8). Again, there are various meaningful policies that assure that the targeted volatility is met.
Increasing the volatility requires to randomly select cash-flows from the base scenario and adding them to one of the other periods where ci>0. Also here the decision needs to be made how much to allocate to which period. Like in the case of reducing frequency, a skewed PDF would allow making the allocation of distributions to periods closer to the fund’s end of lifetime more likely. In case of contributions the last cash-flow would be allocated to the first period; both treatments are consistent with a pessimistic scenario.
Decreasing a cash-flow scenario’s volatility requires shifting amounts from the largest to the smallest cash-flows so that they level out. We need to determine which cash-flows need to be reduced by which amounts and to which other period’s cash-flows these amount should be added.

The constraints imposed by the total commitment size in case of the contributions and the targeted TVPI in case of the distributions create interdependencies between changes in frequency and volatility of cash-flows. Afterwards the fund's new cash-flows need to be considered to determine its cash-flow consistent NAV and other exposure measures.
Conclusion
It is good practice to model uncertainty by adding stresses. The stress factors applied help to examine the effect of different assumptions and methods on a portfolio. It is not possible to say that a certain variation will have a positive effect only; at the same time there can be adverse effects, too. Stress testing taking combinations of the stresses into consideration helps investors to understand the range of potential future outcomes.
The robustness of forecasts for portfolios of such funds is mainly assessed through market replays, stresses on fund lifetimes and cash-flows, which was the focus of this discussion. Other important stresses like the impact of changes in foreign exchange rates, and notably dependencies between funds and their cash-flows, however, go beyond the scope of this article[25].
Footnotes:
[1] See ‘The Price of Panic’. 3 March 2022. Available at https://www.hartfordfunds.com/insights/investor-insight/client-seminars/media-replay/the-price-of-panic.html, [accessed 5 September 2013]
[2] See Meyer (2014).
[3] See Schneider et al. (2022).
[4] The so-called ‘denominator effect’ is the typical impact that market downturns have on institutional portfolios. While the denominator (i.e., the total portfolio’s value) shrinks, the numerator grows in relative terms: the NAVs reported by funds hardly change as write-downs in their valuations lag those of quoted asset classes. Even though nothing has really changed for the funds and capital continues to be deployed consistently, the percentage invested in private assets looks much higher than the targeted allocation. The problem with strict allocation targets is that the illiquidity of private capital is largely ignored and reactions to this denominator effect are often improvised.
[5] See Aalberts et al. (2020).
[6] See Aragon (2008) and, additionally, Lowe (2009): ‘Clear signs began to emerge from the end of 2008 that pension funds and other institutional investors, particularly in the United States, were struggling with a lack of liquidity […] Reports in the press suggested many institutions were struggling to meet capital commitments from private equity funds, with some putting pressure on general partners to delay such calls or to negotiate a reduction in commitment.’
[7] See Vardi (2009).
[8] See Murphy et al. (2022).
[9] See Robinson and Sensoy (2016).
[10i] Gottschalg (2020) composed a sample of 429 private equity funds from vintage years 1999 through 2008 derived from a larger cash-flow dataset maintained by Preqin.
[11] See Gottschalg (2020).
[12] See Hammond et al. (2023): ‘Venture capitalists are advising start-ups to postpone plans to go public in the US until interest rates have plateaued, after choppy debuts for Arm and Instacart damped investors’ hopes for a rush of tech listings.’
[13] See Murphy et al. (2022).
[14] See Aalberts et al. (2020).
[15] From a practical perspective the rating agencies (e.g. Fitch, Moody’s, Standard & Poor’s, DBRS) recognize the peculiarities of illiquid alternative assets. Their methodologies for rating private equity securitizations are based on cash-flow historically observed for comparable funds and put less emphasis on a fund’s NAV.
[16] See, for instance, Fayvilevich et al. (2018).
[17] Appelbaum and Batt (2014) discuss various research findings on the average life-time of private equity funds. They find that a ‘life span of ten years for a PE buyout fund seems to be a more reasonable estimate than five to six years. Other researchers consider ten years (or more) to be the typical life span of a PE fund.’ See also Lykken (2018): ‘Private equity moves at a glacial pace. While the average shelf life of a PE fund is often assumed to be eight to 10 years, many funds require considerably more time to wind down.’
[18] Moody’s performs modelling stresses in its assessment of cash-flows and capital calls including severe adverse scenarios, which impact the overall level of returns. Furthermore, impacts on the alteration of the drawdown and distributions schedules have also been considered. See Perrin et al. (2006).
[19] See Perrin et al. (2006). Moody’s assesses the impact of cash-flow related stresses by frontloading the drawdowns (by up to 2 years) and delaying the distributions (by up to 2 years) to assess the impact.
[20] If the average projected timing of both is kept constant, lumpier drawdowns and distributions place more pressure on liquidity resources than more smoothly distributed ones. See Kalra et al. (2006).
[21] Concentrated portfolios can lead to lumping of cash-flows and larger amounts of cash to be paid in periods of significant distributions. See Chen et al. (2018)
[22] For instance, DBRS performs additional analysis assuming large distributions as a stress. See Chen et al. (2018).
[23] See Kalra et al. (2006).
[24] In statistics volatility is defined for a given time interval. Here, to keep it simple, this interval is assumed to be the fund’s remaining lifetime.
[25] This is dealt with, for example, in Meyer (2024)
Bibliography
Aalberts, Edo, Peter Cornelius, and Lucas van der Kamer. 2020. ‘Cash Flows During Financial Crises’. Paper. AlpInvest. June.
Appelbaum, Eileen and Rosemary Batt. 2014. Private Equity at Work: When Wall Street Manages Main Street. New York: Russell Sage Foundation.
Aragon, Lawrence. 2008. ‘LPs Are on the Ropes’. peHUB. 7 July. Available at http://www.pehub.com/2008/11/07/lps-are-on-the-ropes, [accessed 5 September 2013]
Aven, Terje. 2015. ‘Implications of black swans to the foundations and practice of risk assessment and management’. Reliability Engineering & System Safety. Vol. 134, pp. 83-91. February.
Barrington, Scott, Danny Zouber, Mike Pohlen, Mark Austin, Gretchen Postula, and Denise Galvin. 2009. ‘Inflation/Deflation – How Does it Affect Leveraged Buyout (LBO) Returns?’ Piper Jaffray Private Capital. Second Quarter.
Brown, Gregory, Wendy Hu, and Bert-Klemens Kuhn. 2021. ‘Private Investments in Diversified Portfolios’. January. Available at https://uncipc.org/wp-content/uploads/2021/02/Asset_Allocation_210129.pdf, [accessed 26 March 2022]
Chen, Siyun, Joseph Priolo, Jerry van Koolbergen and Claire Mezzanotte. 2018. ‘Rating U.S. Collateralized Fund Obligations Backed by Private Equity.’ Methodology paper. DBRS. November.
Doimi de Frankopan, Nicholas. 2009. “Private equity and the ‘new normal’”. IPE Magazine. December. Available at https://www.ipe.com/private-equity-and-the-new-normal/33378.article , [accessed 26 May 2021]
Fayvilevich, Greg, Igor Gorovits, Brian Knudsen, Ralph Aurora and Alastair Sewell. 2018. ‘Astrea IV Pte. Ltd.’ Fitch Ratings – Fund and Asset Manager Rating Group. June 14.
Gottschalg, Oliver. 2020. ‘Initial Insights into the possible impact of the Covid-19 Crisis on Private Equity Cash Flows in 2020’. Unpublished Working Paper. April.
Hammond, George, Tabby Kinder and Ivan Levingston. 2023. ‘VCs urge start-ups to delay IPOs after Arm and Instacart hit by volatility’. Financial Times. 2 October.
Kalra, Raman, Alan Dunetz, Richard Hrvatin and Richard Green. 2006. ‘Going Public with Private Equity CFOs.’ Fitch Ratings – Structured Finance. February 6.
Lowe, Richard. 2009. ‘Commitment issues’. IPE RA magazine. March. Available at https://realassets.ipe.com/commitment-issues/31006.article, [accessed 13 May 2020]
Lykken, Alex. 2018. ‘The pros & cons of long-dated funds.’ June 18. Available at https://pitchbook.com/news/articles/the-pros-cons-of-long-dated-funds, [accessed 13 May 2020]
McGuinness, Rob. 2020. ‘How to Stress Test Your Foreign Exchange (FX) Risk in the Wake of COVID-19’. Payments Journal. 22 June. Available at https://www.paymentsjournal.com/how-to-stress-test-your-foreign-exchange-fx-risk-in-the-wake-of-covid-19/, [accessed 29 September 2023]
Meyer, Thomas. 2014. Private Equity Unchained – Strategy Insights for the Institutional Investor. Houndsmill, Basingstoke, Hampshire: Palgrave Macmillan.
Meyer, Thomas. 2024. The Art of Commitment Pacing – Engineering Allocations to Private Capital. Chichester: John Wiley and Sons.
Murphy, Daniel, Juliana Hadas, and James Gelfer. 2022. ‘Calling Patterns: Why Private Fund Cash Flow Management May Need to Evolve’. 15 December. Available at https://www.gsam.com/content/gsam/us/en/advisors/market-insights/gsam-insights/perspectives/2022/calling-patterns-why-private-fund-cash-flow-management-may-need-to-evolve.html, [accessed 26 April 2023]
Perrin, Ian, Marlow Gereluk and Marco Szego. 2006. ‘SVG Diamond Private Equity II Plc.’ Pre-Sale Report. Moody’s International Structured Finance. January 26.
Reinhart, Carmen M. and Kenneth S. Rogoff. 2009. This Time Is Different - Eight Centuries of Financial Folly. Princeton University Press.
Robinson, David T. and Berk A. Sensoy, 2016. ‘Cyclicality, performance measurement, and cash flow liquidity in private equity’, Journal of Financial Economics. Vol 122(3), pages 521-543.
Schneider, Jerome, Sean Klein, Wade Sias, and Simon Fan. 2022. ‘Cash for Calls: A Quantitative Approach to Managing Liquidity for Capital Calls’. The Journal of Alternative Investments. Fall.
Vardi, Nathan. 2009. ‘Did Harvard Sell At the Bottom?’ Forbes. 24 October. Available at https://www.forbes.com/2009/10/24/harvard-university-endowment-business-wall-street-harvard.html?sh=5e476a3f6c4a, [accessed 27 September 2022]
The views expressed in this article are solely those of the author and do not necessarily reflect the views of SimCorp.
About the Author:
Dr. Thomas Meyer is the managing director of SimCorp Luxembourg s.a.r.l. (part of Deutsche Börse Group). He has held an international career in and out of the financial services, from intelligence officer in the German Air Force to regional CFO of Allianz Asia Pacific in Singapore. He was responsible for the creation of the European Investment Fund’s risk-management function with a focus on building valuation and risk-management models and investment strategies for venture capital funds of funds. Since 2020, he has been leading the development of SimCorp Dimension’s Alternatives Strategy solution.
Thomas is a Shimomura Fellow of the Development Bank of Japan and was a visiting research fellow at Hitotsubashi University in Tokyo. His he just published his new book ‘The Art of Commitment Pacing’ (by Wiley). He is the co-author of Beyond the J Curve (translated into Chinese, Japanese, and Vietnamese), J-Curve Exposure, Mastering Illiquidity (all by Wiley), and two CAIA books, which are required reading for Level II of the Chartered Alternative Investment Analyst® Program. He authored Private Equity Unchained (by Palgrave MacMillan).
"All posts are the opinion of the contributing author. As such, they should not be construed as investment advice, nor do the opinions expressed necessarily reflect the views of CAIA Association or the author’s employer."