


By Michael Green, Portfolio Manager and Chief Strategist at Simplify.
Editors Comment: Michael Green is the leading proponent of the idea that passive investing is distorting markets so he touches on that and then gets into the GDP thing.
First, an update on fund flows and the impact:
For the heck of it, I ran a regression that helps illustrate just how little the returns of the S&P500 have to do with anything. While the Shiller P/E now has a poor reputation, it’s easy to forget that post Dotcom it was “the answer.” Like systematic value investing, it “just made sense” that valuation determined returns. Strategic asset allocation became a popular past-time. For obvious reasons, that has given way to largely fixed model portfolios that assume endogenous returns free of valuation inputs:
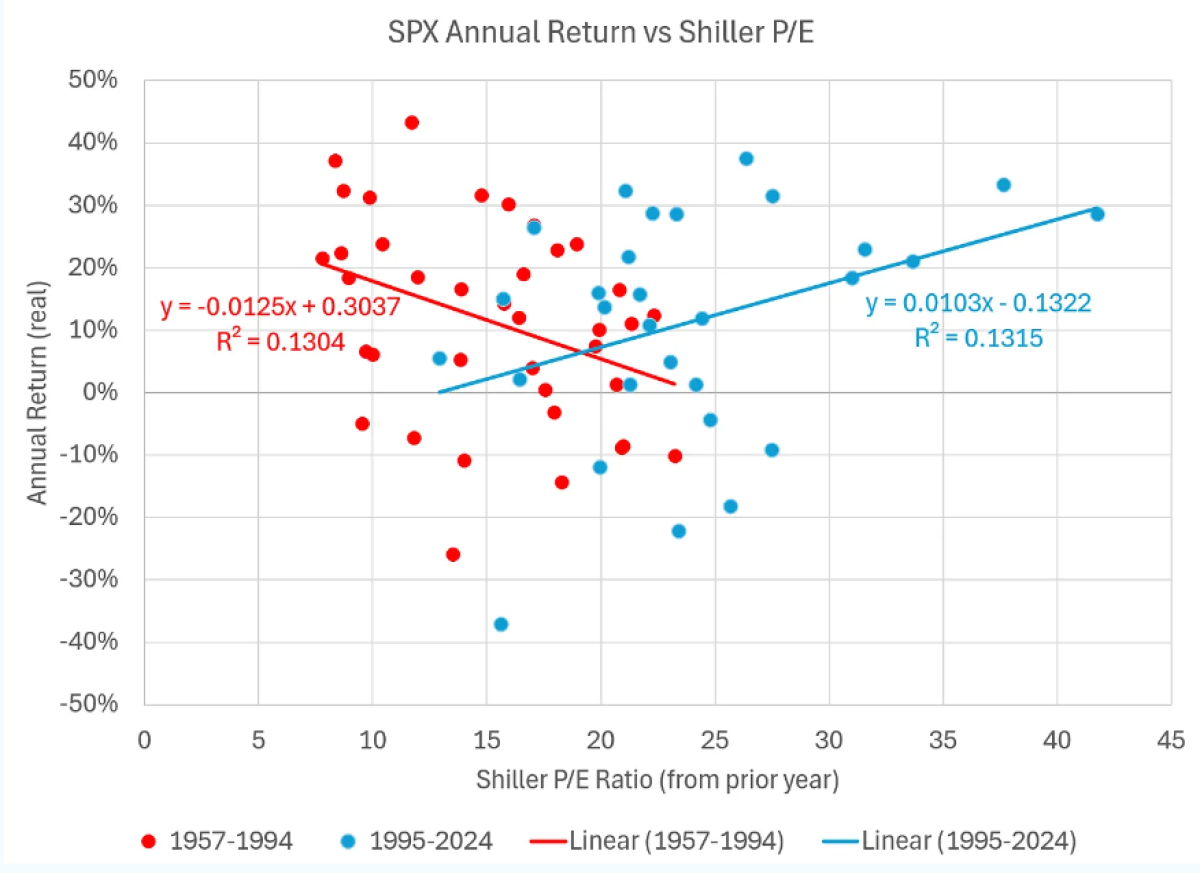
The adaptive markets at work? Well, yes… but as you now know, passive is playing a role as well.
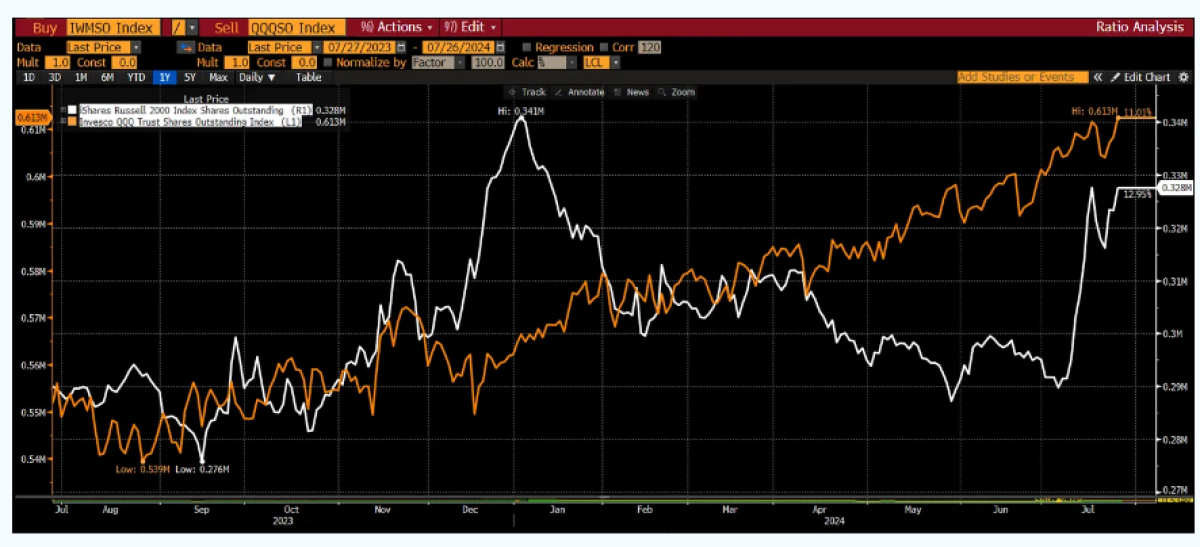
The past few weeks have been a textbook lesson on fund flow impact. $IWM has been on fire as L/S traders have used it to unwind their long Fang/short IWM books. This has powered the small-cap indices higher as the FANGs have retreated.
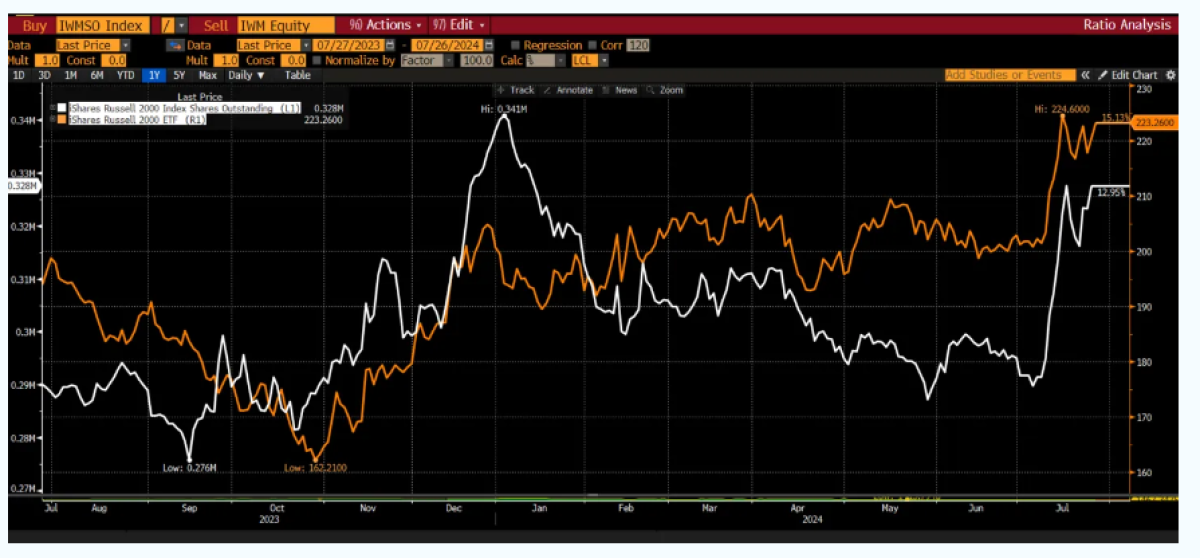
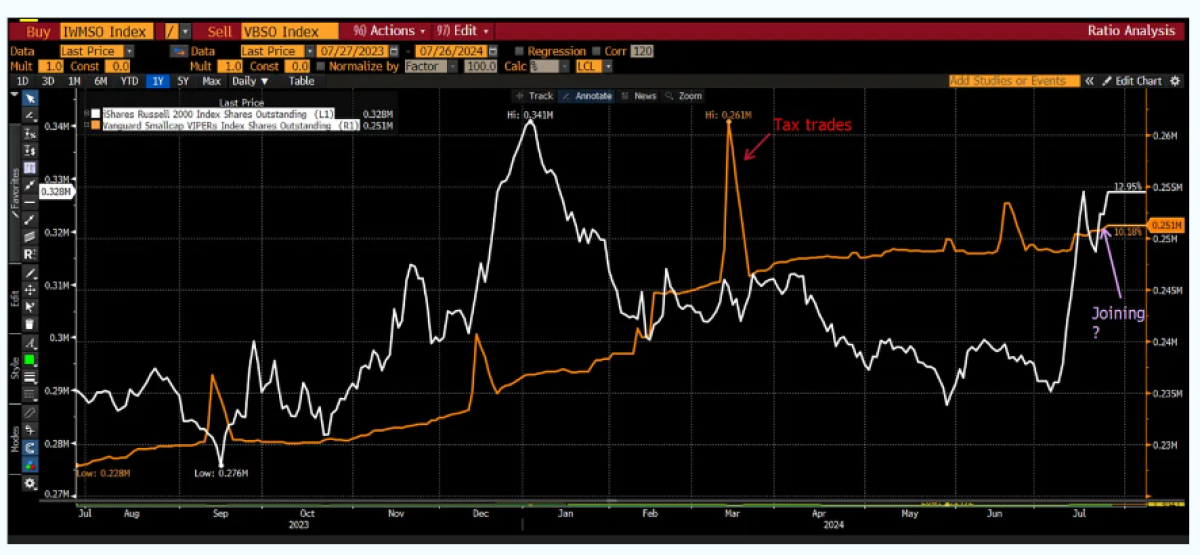
There is some evidence that retail is joining the party with modestly increased allocations to Vanguard's Small Cap ETF. Still, the numbers pale in comparison. Vanguard small-cap inflows were ~$500MM versus $IWM inflows of ~$7.5B. While these are far from the only flows, dimensionalizing them is helpful. On roughly $8-10B of inflows into small-cap ETFs, the market cap of the R2000 has climbed nearly $200B. Unfortunately, this is uncomfortably close to my 2022 estimate of 17:1 market cap:$ inflow.
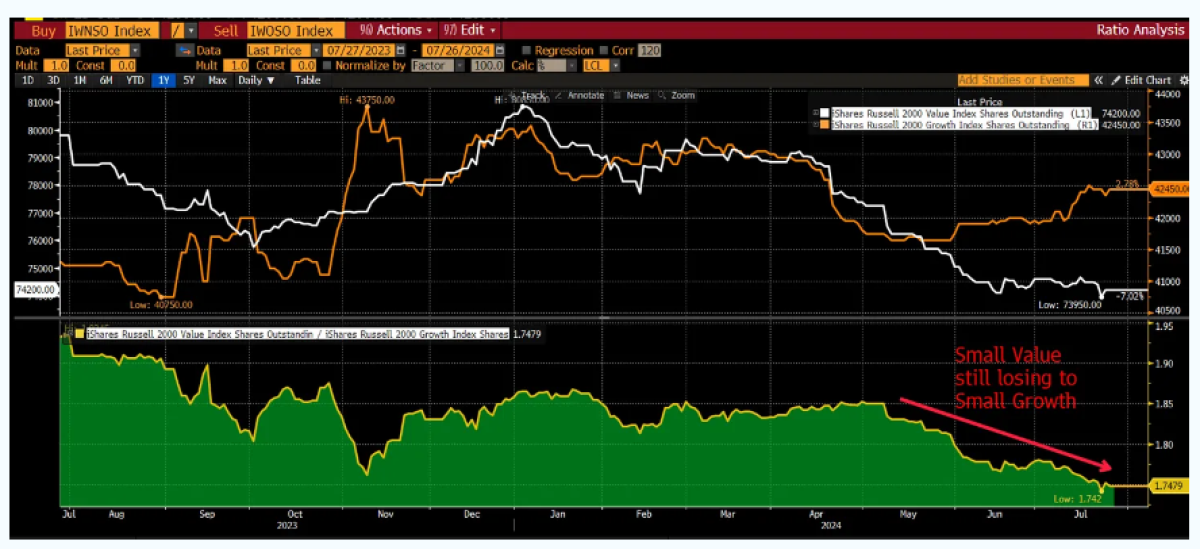
However, for those pitching the rotation story, there has been no meaningful sector selection or style shift. Where we are seeing inflows (other than “Small Cap!” [h/t Ben Hunt]) is Small-Cap Growth, not Value.
And flows into QQQ took a short dip… but that’s all it was — a short dip followed by renewed inflows into QQQ.
And for those who prefer their investments to be “truly passive,” buying all US stocks in proportion to their market cap via Vanguard’s total market index ETF, the entire story likely leaves them wondering what the fuss is about. There has been no change in trend.
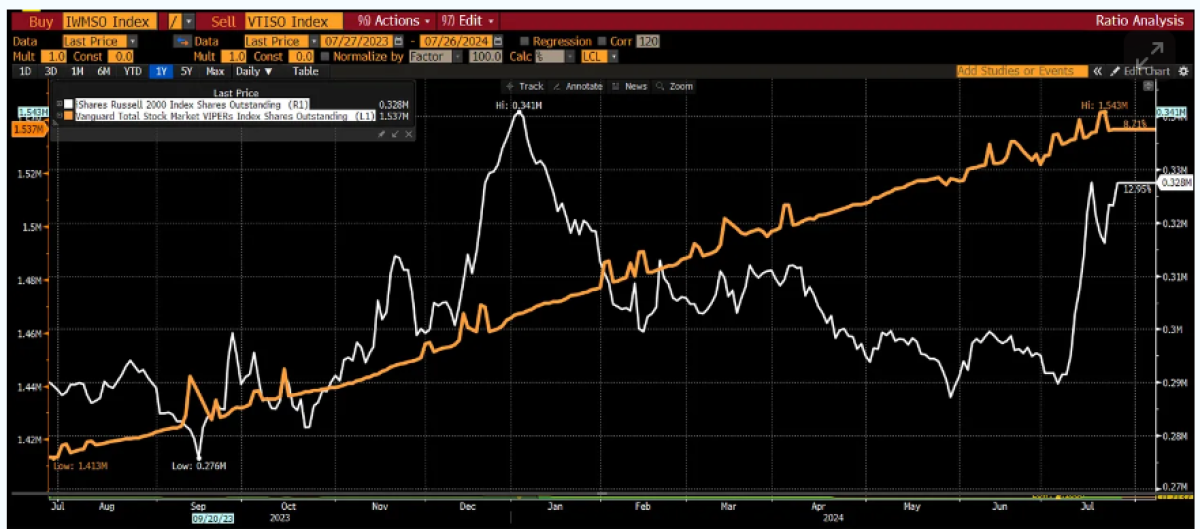
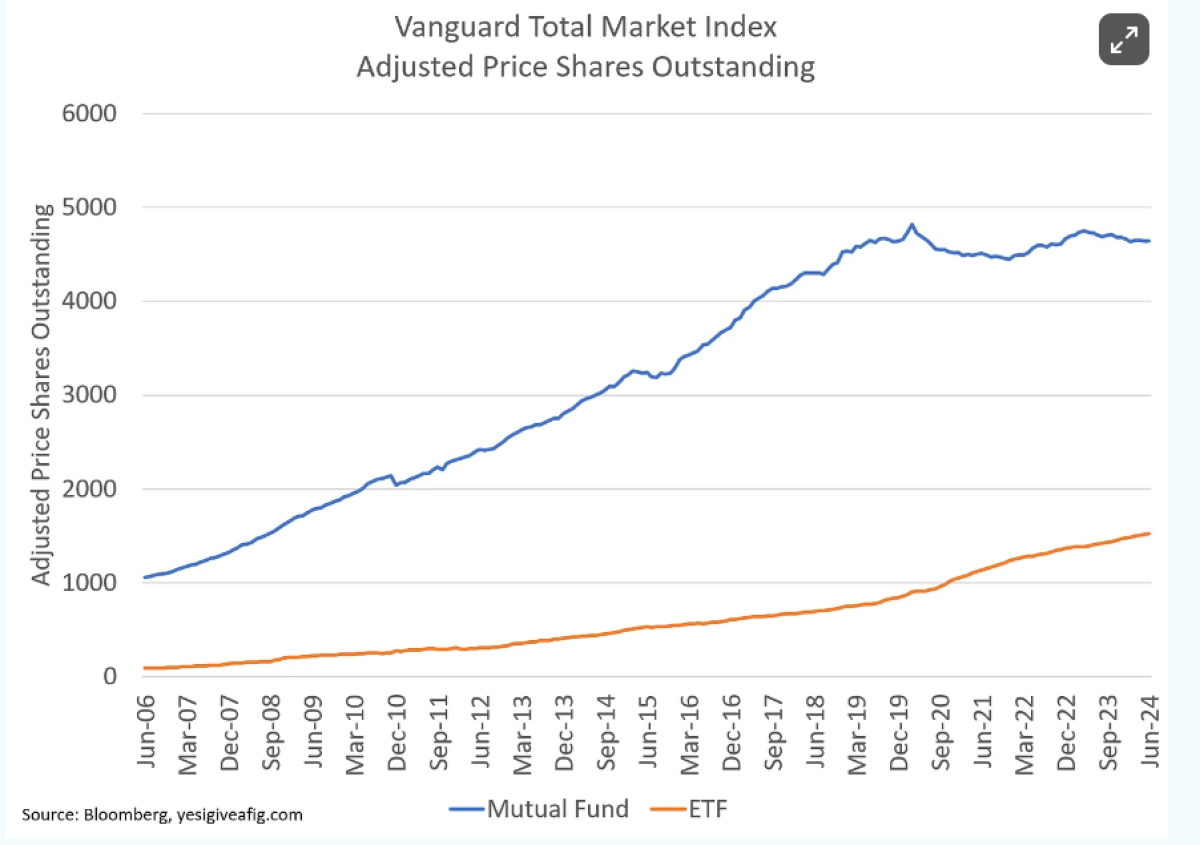
While we are hearing about record inflows into ETFs, this has almost exclusively occurred in “trader” dominated IWM. Mutual funds continue to hemorrhage. While we won’t have the monthly data for Vanguard’s mutual fund variant, June was yet again another declining month for the total market mutual fund. In an unprecedented shift, flows into Vanguard’s dominant mutual fund for QDIA and Target Date Fund usage have been flat since March 2020. It’s all about ETFs now.
But sometimes, we need a little more detail before we can dismiss the narrative entirely… like Thursday’s GDP print. A surprisingly strong number (more on that later) ultimately led to the Nasdaq 100 to sell off while the R2000 rallied roughly 1%. By the end of the day, a clear narrative had taken hold: “A soft/no landing scenario would benefit smaller companies while good results on the GDP deflator would assist the Fed in rate cuts. The rotation continues!” It’s possible but unlikely.
As noted above, we are starting to see additional buying of Vanguard’s small-cap ETF (VB). However, the entirety of the move was tied to the opening 30 minutes — when pre-orders for ETFs are unloaded into the market. The R2000 again rose on the open while the NDX (powered by single stocks) declined. After 10 am, they traded in lockstep. A perverse way to deliver negative correlation for the day — 30 minutes of opposite and then 6 hours of lockstep price action:
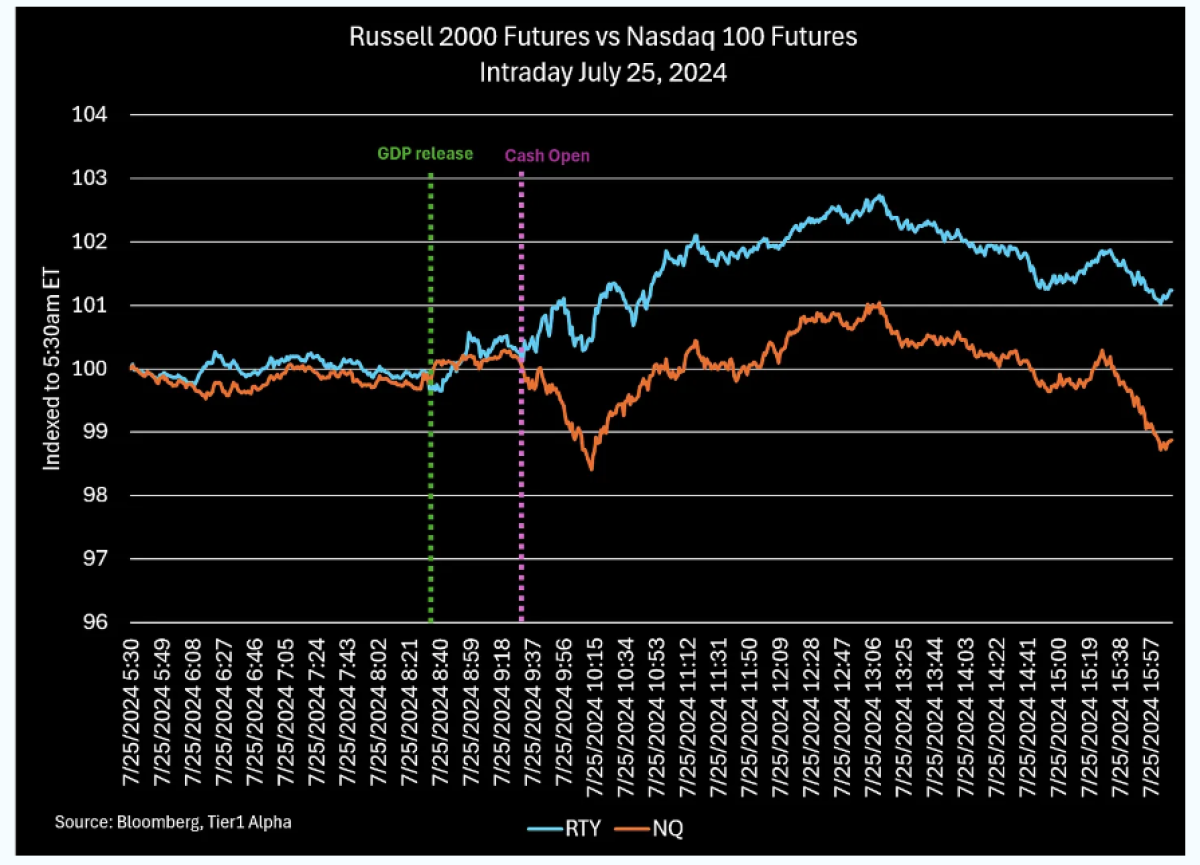
Believe it or not, it was even weirder than that. The correlation (beta) of the R2000 was actually positive to the Nasdaq 100 during those 30 minutes. However, the idiosyncratic return (alpha) of the R2000 was an annualized 4,087% over those 30 minutes. And then returned to exactly what it had been prior to 9:30 am.
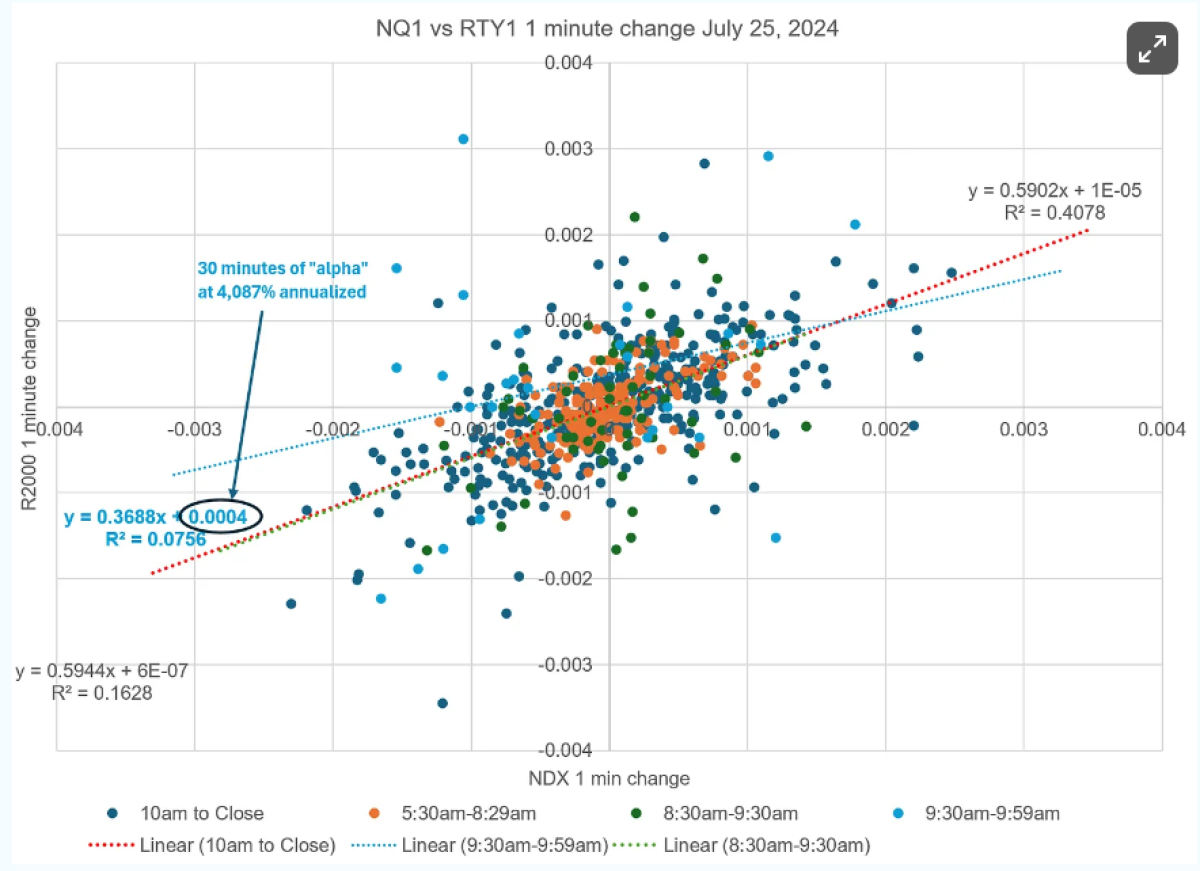
This 30-minute sprint added roughly $15B to the R2000 market cap on inflows of ~$200MM. A multiplier of 75x. To quote Bill Sharpe:
“A passive investor always holds every security from the market”
Yeah, that’s what it is… “passive” investment.
Now About that GDP Report
This is going to be an odd segue. Once again, I don’t know the answer, but something is deeply weird. One of the reasons you heae me focusing so intently on the employment data is because it sits at the core of one of my GDP proxies. You can access it on Fred here.
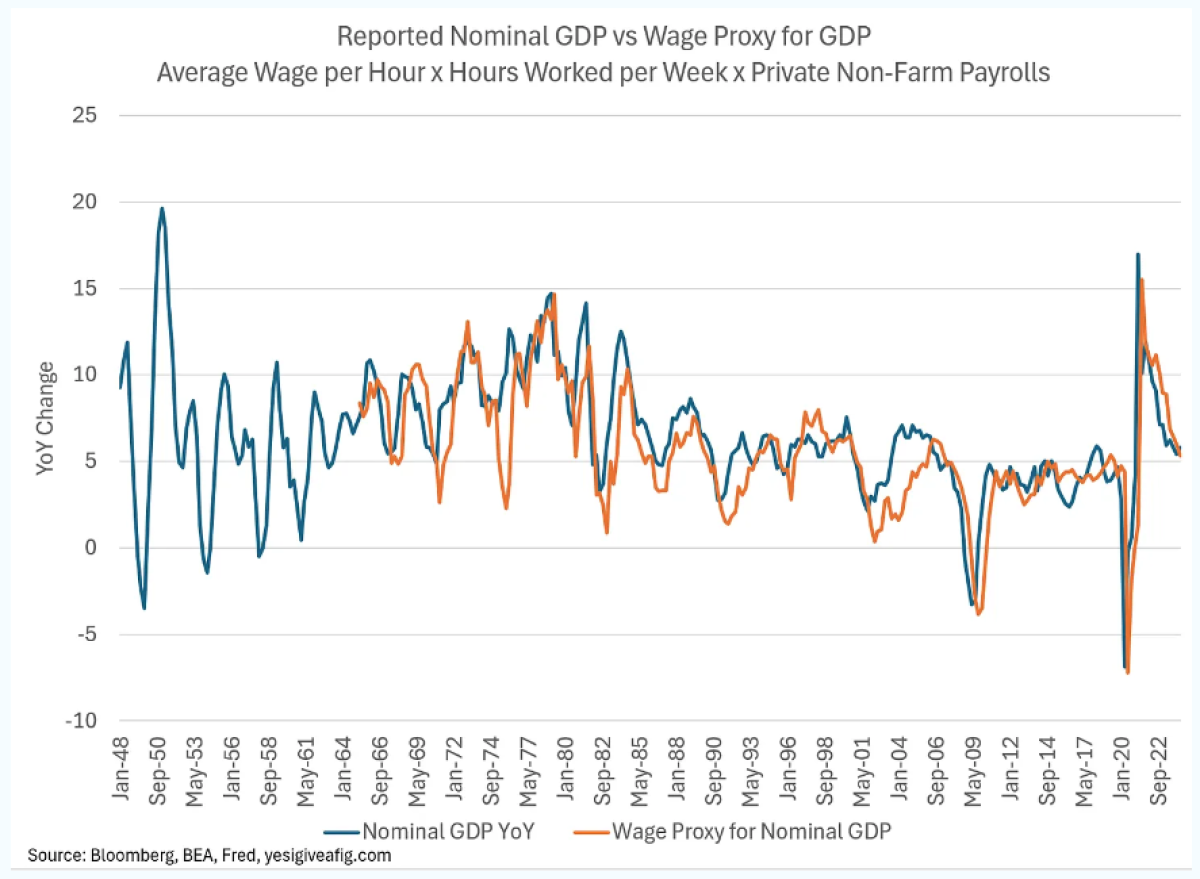
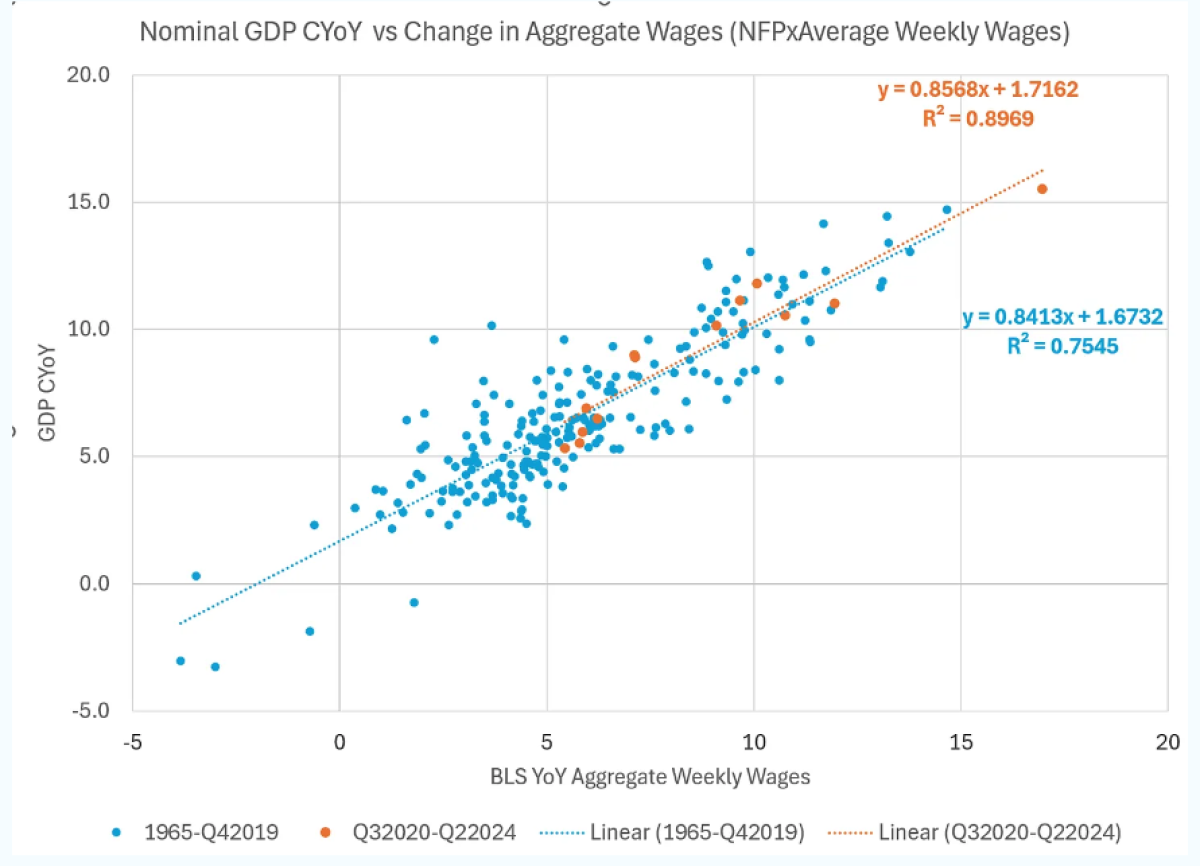
By using aggregate wage income, we can get a very reasonable real-time indicator for GDP. Now, this has, in many ways, been replaced by far more holistic models like the Atlanta Fed’s GDPNow, but unlike GDPNow, it’s an actual calculation rather than a multi-variable linear regression used to “tune” GDP estimates over the course of a quarter. In many ways, my calculation is much more tied to GDI as I’m simply capturing the YoY aggregate wages of workers, but it’s a useful bottoms-up estimate that should be reasonably close to GDP.
From 1965 until Q4-2019, this proxy captured 75% of the variability in the annual rate of change in nominal GDP. Enough to provide a meaningful edge. But recognize what I’m not capturing — imports & exports, the deficit, inventories, or even profit from the corporate sector. All of these can be significant influences on reported GDP, and the aggregate complexity of tracking GDP is often self-defeating. Just ask the majority of polled economists in Bloomberg, who have been consistently too low in the past few years. My simple model has the unenviable characteristic of being slow to recoveries as hiring often lags the initial stages of a recovery. For this, I use the inventory cycle as the primary tool. On the flip side, it is typically “fast” to recessions — a useful property for forecasting economic activity in a public market that is expected to anticipate a recession. But these characteristics mean that while the entire period has a relatively high R-sq, the performance of this proxy over any shorter period is much lower.
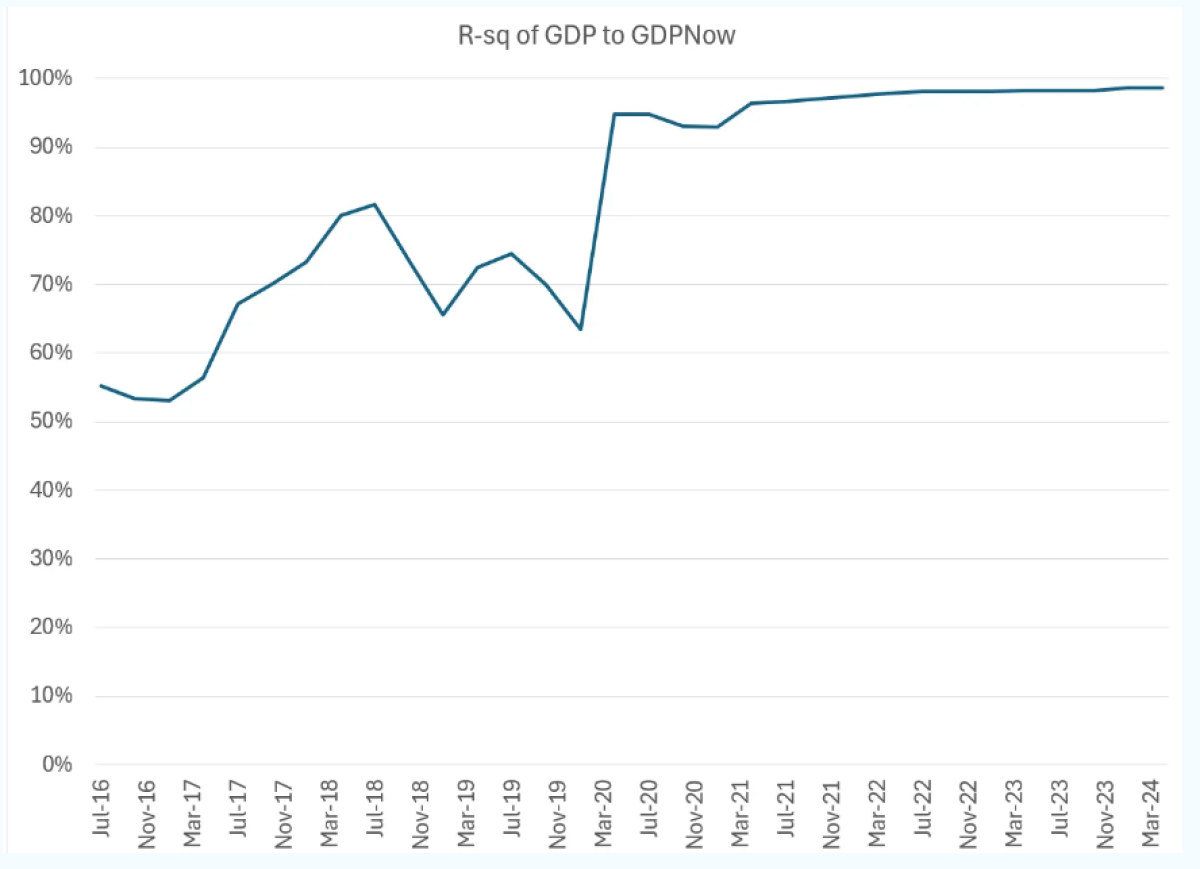
Due to the reliance of this model on NFP, I very closely monitor changes in employment separately from GDP. And you, poor reader, are the victim of this obsession. But oddly, it no longer seems to matter. Starting around 2006, the R-sq of the model began to improve. Since Covid it has been borderline perfect:
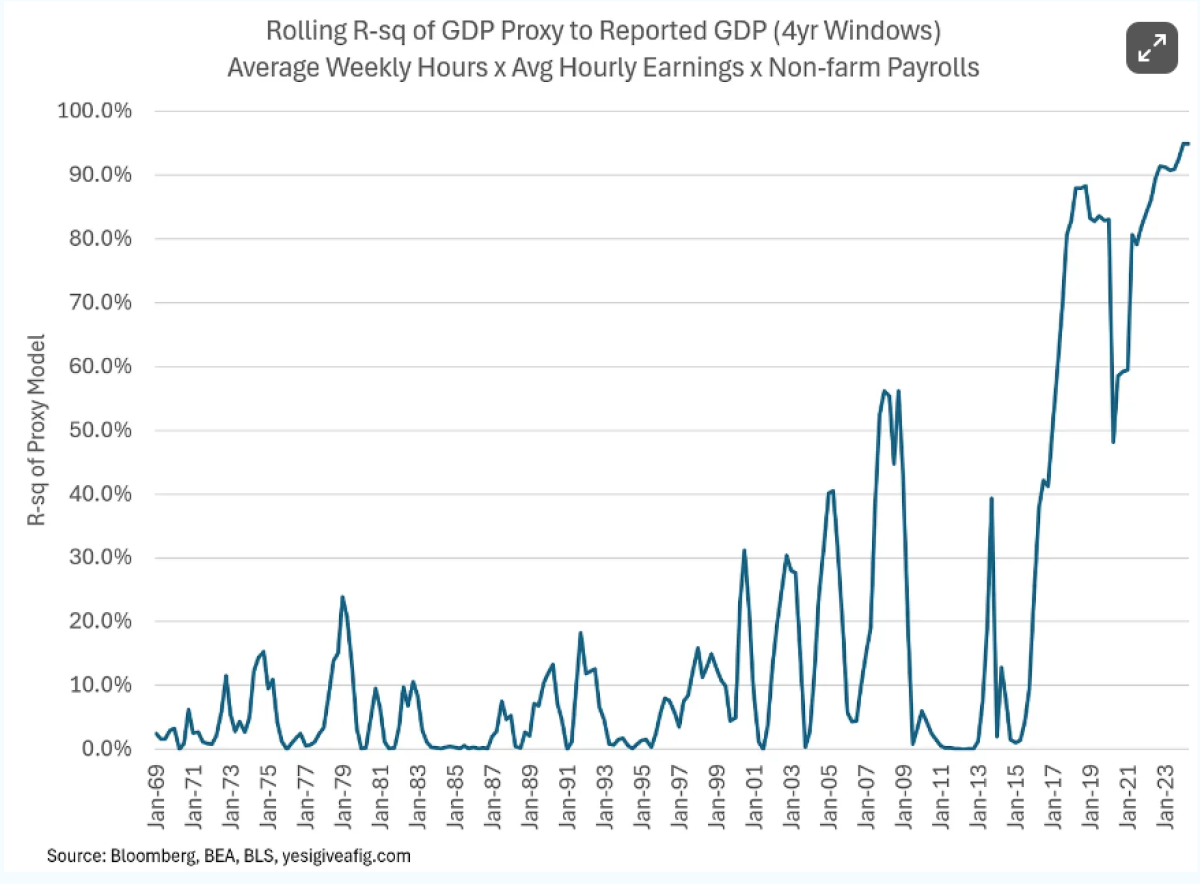
Too perfect, in fact. The probability of a model that has historically tracked GDP with a reasonable but far from perfect R-sq suddenly jumping to 90% plus accuracy is vanishingly low, particularly when the period in question has contained so many “unprecedented” events, including a record number of revisions to NFP and a QCEW report that largely validates my skepticism of the NFP use of Birth/Death. So what’s going on?
Well, as I said, I don’t know. But I have a hunch, and it’s not a conspiracy to re-elect Joe Biden or Kamala Harris.
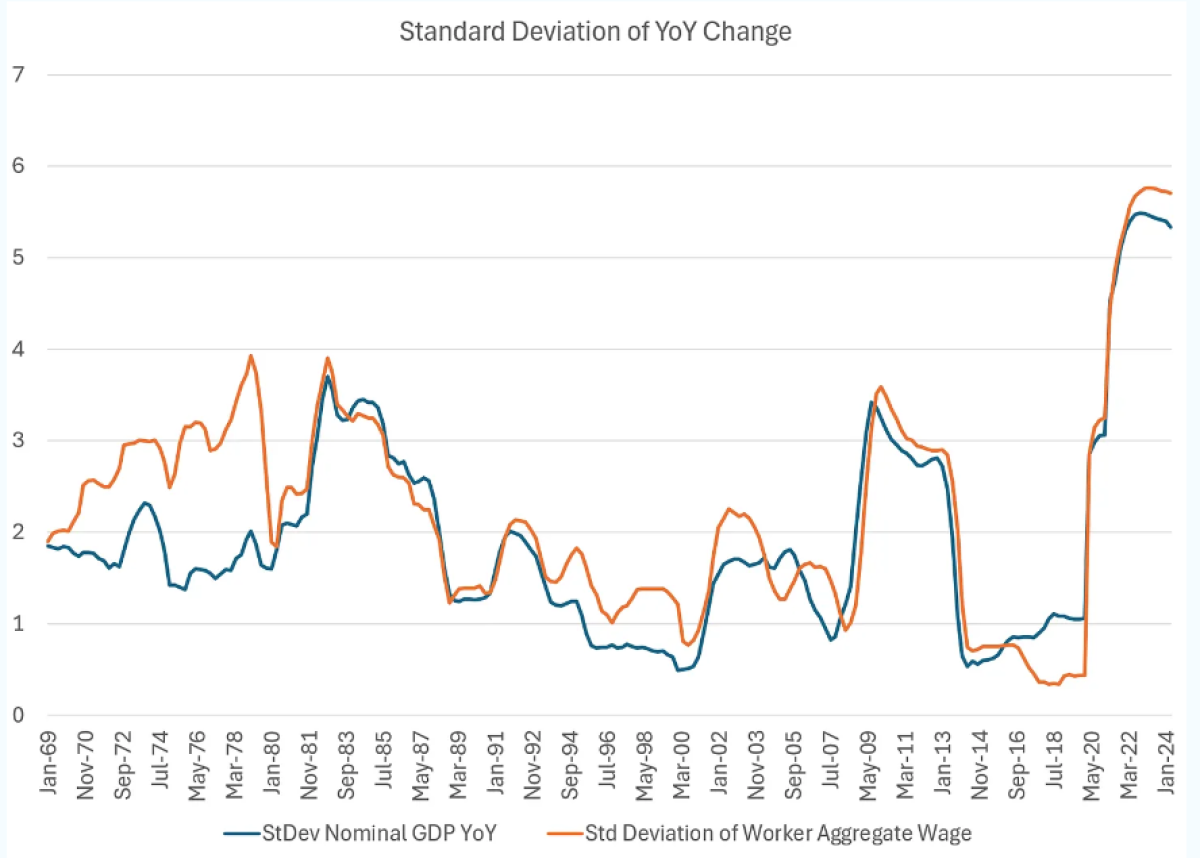
The first observation is that the Great Moderation came to a close with a bang. Since 2020, the volatility of nominal GDP has exploded. Higher volatility offers more change to explain, and with nominal GDP reported in 10ths, that can obviously be a driver. But note that while similar volatility in the 1970s led to rise in the R-sq, it came nowhere close to the current cycle. Nor did the volatility in the post-GFC:
The second hunch is pure speculation and unsupported by available direct evidence. But I’m pretty sure it’s right. Post-Covid, the survey response rates across institutions have plummeted. This must be true for GDP as well. When the survey response rates are low, the BEA estimates more:
“BEA estimates the data for these entities by extrapolating forward their data from the most recent benchmark survey based on the movement of the sample data.”
Much like the NFP (and JOLTS and…), I think we are not getting “actual” data. We are getting estimates based on the “movement of the sample data.” How do they generate those estimates? Well, it’s largely linear regressions of how the GDP responded in the past to changes in data. These reaction functions get updated every five years. The most recent benchmark indexed to 2017-2022 and won’t be changed until 2028. By benchmarking to a data set that includes all the variance and whackadoodle (technical term) of 2017-2022, we’ve created a forecast that ASSUMES this behavior continues.
In other words, we’re getting GDPNow, not GDPActual. Like the NFP data with Birth/Death, this means we are particularly susceptible to revisions that will ultimately tell us years later what actually happened over 2023-2024. It also helps to explain why GDPNow has been so much more accurate than “professional” economists (or those who play them on TV), even as those economic forecasters have been dead right about the revised data. If we run the same analysis for GDPNow, instead of my super simple model, we should see a similar improvement if my hypothesis is correct.

As you have heard me plagiarize repeatedly, “Never assume conspiracy when incompetence will suffice.” Forgive them, they know not what they do.
"All posts are the opinion of the contributing author. As such, they should not be construed as investment advice, nor do the opinions expressed necessarily reflect the views of CAIA Association or the author’s employer."
About the Author:
Michael Green, CFA, has been a student of markets and market structure, for nearly 30 years. His proprietary research into the shift from actively managed portfolios and investment funds to systematic passive investment strategies has been presented to the Federal Reserve, the BIS, the IMF and numerous other industry groups and associations.
Michael joined Simplify in April 2021 after serving as Chief Strategist and Portfolio Manager for Logica Capital Advisers, LLC. Prior to Logica, Michael managed macro strategies at Thiel Macro, LLC, an investment firm that manages the personal capital of Peter Thiel. Prior to Thiel, Michael founded Ice Farm Capital, a discretionary global macro hedge fund seeded by Soros Fund Management. From 2006-2014, Michael founded and managed the New York office of Canyon Capital Advisors, a $23B multi-strategy hedge fund based in Los Angeles, CA, where he established their global macro strategies, managing in excess of $5B of exposure across equity, credit, FX, commodity and derivative markets.
In addition to his work as a market theorist and portfolio manager, Michael has been noted for his work as a public speaker and financial media participant. He is a graduate of the Wharton School at the University of Pennsylvania and a CFA holder.
