


By Fernando Walter Lolo, CAIA
Chart patterns are powerful tools in technical analysis, helping traders identify potential trend reversals, continuations, and breakout opportunities. These formations reflect market psychology and historical price behavior, appearing consistently across timeframes and cryptocurrencies—especially in Bitcoin, given its liquidity and volatility. This two-part guide explores 20 essential chart patterns, detailing their structure, reliability, and trading strategies using Fibonacci retracements and extensions. While powerful, patterns should be used with context and caution. Keep in mind:
Volume confirms validation: Genuine breakouts/breakdowns are typically accompanied by increasing volume, while false breakouts often lack momentum.
Multi-timeframe analysis strengthens signals: Patterns appearing on higher timeframes (daily/weekly charts) tend to be more reliable.
Risk Management is essential: even the most reliable patterns fail occasionally. Traders should always use stop loss orders, maintain proper position sizing, and conduct suitable risk management to each cryptocurrency type.
Chart patterns aren’t crystal balls, but they do provide a structured way to assess probabilities. When combined with Fibonacci levels, volume analysis, and disciplined risk management, they form a systematic approach to trading. Whether you're a day trader chasing pennant breakouts or a swing trader eyeing cup-and-handle setups, mastering these patterns enhances decision-making and confidence. Remember that no single pattern guarantees success; traders should always look for confluence across multiple indicators and adapt to changing market conditions. Continuous practice and back-testing refine the ability to spot high-probability setups, ultimately leading to more consistent trading performance.
This analysis reflects my own charting, calculations, and assessments using TradingView.com, based on the best available data at the time of writing. It is intended for educational and illustrative purposes only, is not financial or investment advice, and is subject to change at any time. Readers should always conduct their own research.
The first article in this series covers 10 foundational patterns, including classic reversals, continuation setups, and consolidation structures, with practical insights into their use in volatile crypto environments. Each pattern includes reliability data, entry/exit strategies, and risk management tips for active traders.
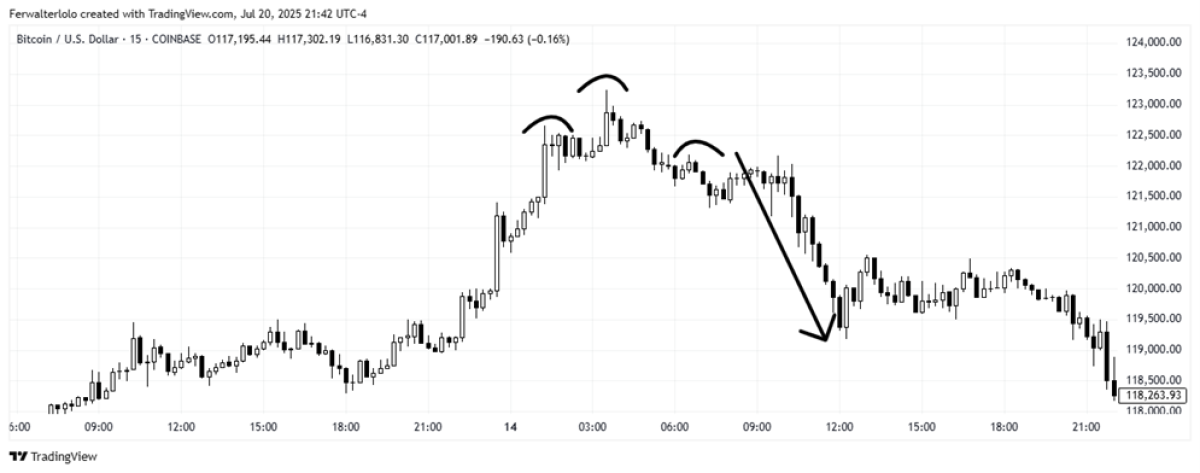
1. Head-and-Shoulders (Bearish Reversal)
The head-and-shoulders pattern is one of the most reliable bearish reversal signals, with an 80% success rate when fully confirmed. It consists of three peaks: a central high point (the head) between two lower peaks (the shoulders), connected by a neckline. The pattern suggests weakening bullish momentum, with the neckline break confirming a trend reversal.
In crypto markets, especially after parabolic rallies, the pattern often reflects shifting market psychology:
Left shoulder: Retail FOMO buying
Head: Institutional distribution
Right shoulder: Exhausted retail demand
Traders typically enter short positions after a confirmed neckline break, targeting a move equal to the distance from the head to the neckline. The 61.8% Fibonacci retracement often acts as resistance before the breakdown.
Pros:
High reliability in bearish conditions
Clear stop-loss placement above the right shoulder
Measured move targets often align well in volatile crypto markets
Cons:
Prone to fake outs in strong bull markets
Neckline breaks may occur on low volume
Tight shoulder-to-head spacing can limit profit potential
Volume confirmation is crucial. Look for at least 25-30% higher volume on the breakdown. Avoid trading this pattern during Bitcoin dominance shifts or thin weekend liquidity. For stronger confirmation:
Wait for a daily close at least 3% below the neckline
Combine with RSI divergence
Take partial profits at the 127% Fibonacci extension
Place stops 1.5% above the right shoulder
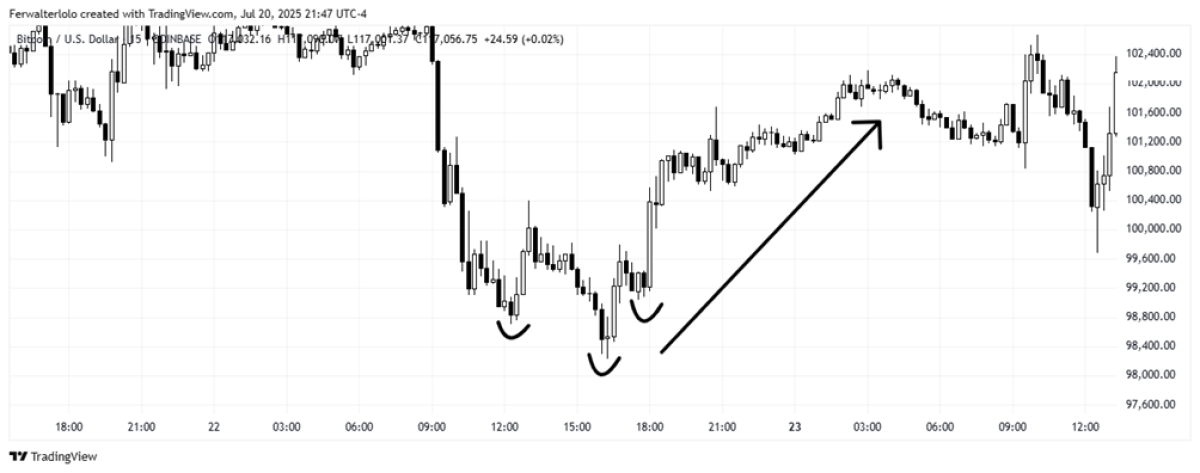
2. Inverse Head-and-Shoulders (Bullish Reversal)
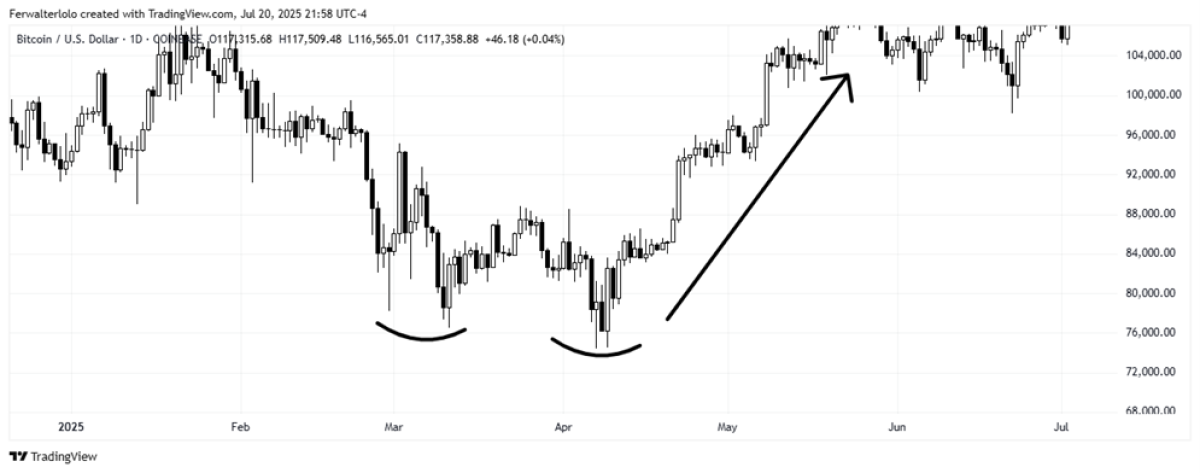
The inverse head-and-shoulders pattern is a mirror image of its bearish counterpart and signals bullish reversals with 80% accuracy. It features three troughs: a deeper low (the head) between two shallower lows (the shoulders), with a neckline connecting the highs. A breakout above the neckline confirms the reversal, with the price target matching the pattern’s height.
In crypto markets, this pattern often marks major bottoms:
Left shoulder: Initial capitulation
Head: Panic selling or liquidity crisis
Right shoulder: Accumulation phase before breakout
Pros:
Effective predictor of trend reversals
Works across all timeframes
Clear risk/reward parameters
Cons:
May take weeks/months to fully form
Right shoulder sometimes undercuts the left, triggering stops
Breakouts often retest the neckline before continuing upward
Once again, volume confirmation is essential; look for at least 30% volume increase on the right shoulder. The pattern is more reliable when BTC dominance is stable or declining, and funding rates should turn positive during formation. For execution:
Enter long on a confirmed breakout above the neckline
Use the 38.2% Fibonacci retracement as support
Target the 161.8% Fibonacci extension of the head-to-neckline distance
Place stops 2% below the right shoulder’s low
Combine with on-chain accumulation data for added confidence
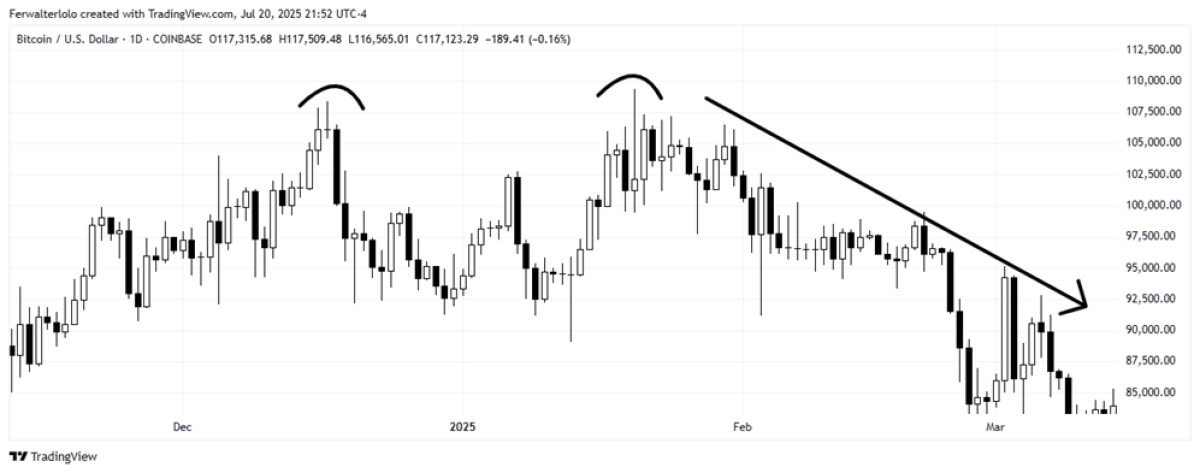
3. Double Top (Bearish Reversal)
A double top forms when price tests resistance twice without breaking higher, indicating exhaustion in an uptrend. The neckline break confirms the reversal, with a 75% success rate. Traders enter short positions on the breakdown, targeting a move equal to the pattern’s height. The 127.2% Fibonacci extension often serves as the first profit-taking level. This pattern develops when price tests a resistance level twice without breaking through, creating two distinct peaks with a moderate trough between them. In crypto trading, double tops frequently appear in altcoins after hype cycles or during periods of waning momentum. The first peak represents the initial rejection, while the second failed attempt shows exhaustion of buying pressure. The breakdown below the trough's support level (neckline) confirms the reversal.
Pros:
Easy to identify on all timeframes
Works well in ranging markets
Clear measured move targets
Cons:
Prone to false signals in highly volatile assets
Second peak may slightly exceed the first (bull trap)
Formation can take time, often days or weeks
There are many false signals in high volatile cryptos, the second peak sometimes exceeds the first (bull trap), and it requires patience as formations may take weeks.
It is worth noting the volume when decreasing by 15-20% on the second peak for the formation, it is more reliable when RSI shows divergence, and it often fails during sudden positive news events. Traders often trade when peaks are 7-10 days apart, wait for a daily close below the neckline, target the 127% Fibonacci extension initially, place stops 1% above the highest peak, and avoid trading this pattern during BTC dominance spikes.
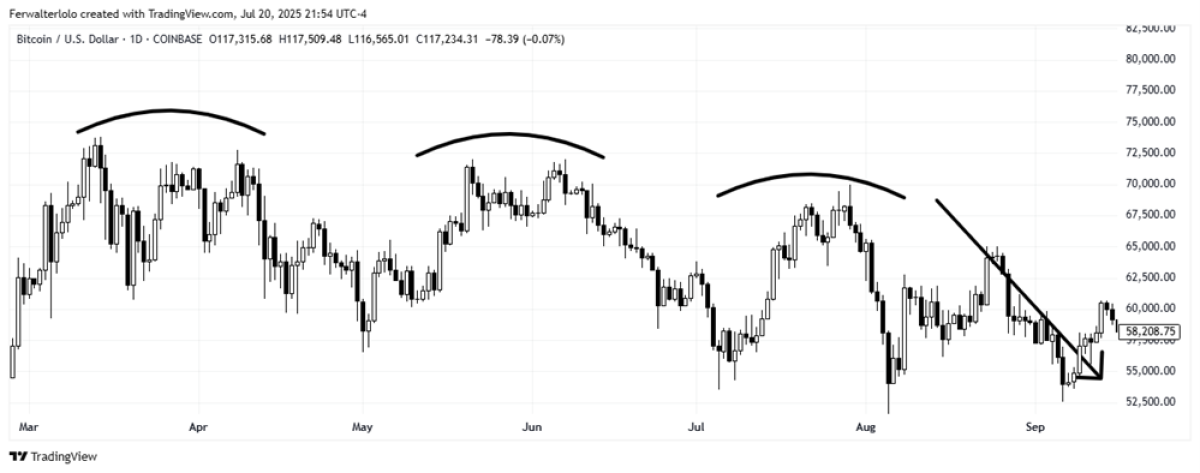
4. Triple Top (Bearish Reversal)
The triple top pattern is a stronger variant of the double top, offering up to an 85% success rate due to repeated resistance tests. It forms when price fails to break through a key resistance level three times, creating three distinct peaks separated by two troughs. A breakdown below the neckline (support connecting the troughs) confirms seller dominance and signals a bearish reversal. In crypto markets, triple tops often emerge during extended consolidation phases, reflecting distribution at resistance and weakening buyer conviction with each failed attempt.
Pros:
Highly reliable
Multiple confirmation points
Often precedes significant breakdowns
Cons:
Rare
May take months to fully develop
Requires patience to trade
Crypto-specific Considerations:
Look for progressively decreasing volume across the three peaks
Monitor declining open interest during formation
Pattern is more reliable when paired with bearish fundamentals
Execution Strategy:
Wait for a confirmed breakdown below the neckline
Target the 161.8% Fibonacci extension of the pattern’s height
Take partial profits at the 127% extension
Place stops just above the highest peak
Confirm with negative funding rates for added conviction
5. Double Bottom (Bullish Reversal)
The double bottom predicts bullish reversals with 75% accuracy, forming when price tests a support level twice before breaking higher. It creates two distinct troughs separated by a moderate peak (the neckline). A breakout above the neckline confirms buyer control and signals a potential rally, with the 161.8% Fibonacci extension serving as a common upside target.
In crypto markets, double bottoms often appear in oversold altcoins or after sharp corrections:
First trough: Initial support and capitulation
Second trough: Accumulation phase before breakout
Pros:
Effective in established uptrends
Clear risk/reward parameters
Often leads to strong rallies
Cons:
Vulnerable to “lower low” fake outs
May take weeks to confirm
Requires volume confirmation
Crypto-Specific Considerations:
Look for a 30%+ volume increase on the breakout
Confirm with positive RSI divergence
More reliable when BTC is stable or rising
Use On-Balance Volume (OBV) to validate accumulation
Execution Strategy:
Wait for a 4-hour candle close above the neckline
Target the 161.8% Fibonacci extension
Place stops below the lowest trough
Take partial profits at previous resistance levels
6. Triple Bottom (Bullish Reversal)
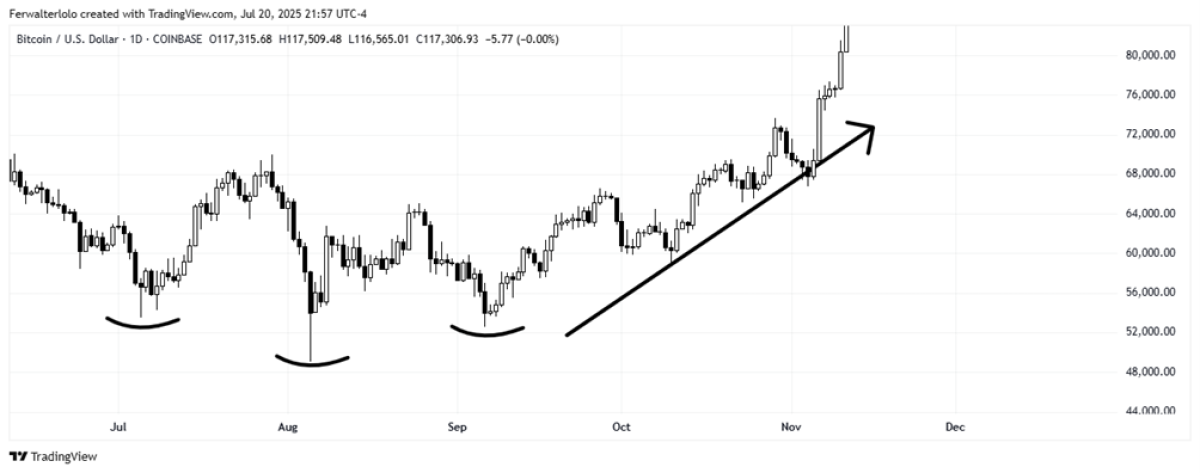
The triple bottom pattern is an enhanced version of the double bottom, demonstrating 85% reliability and showing complete selling exhaustion. This formation occurs when price tests a support level three times without breaking through, creating three distinct troughs separated by two moderate peaks. A breakout above the neckline (resistance connecting the peaks) confirms accumulation and signals a potential rally, with the 261.8% Fibonacci extension often marking long-term upside targets. In crypto, triple bottoms often mark major accumulation zones where institutional players are establishing positions. Each successful support test shows stronger buying interest, leading to eventual breakout. The pattern confirms when price breaks above the resistance level connecting the peaks.
Pros:
High reliability
Signals strong accumulation
Often precedes extended rallies
Cons:
Takes time to develop
Requires patience to trade
May experience multiple retests
Crypto-specific Considerations:
Volume should decrease with each trough
Look for increasing spot buying volume
Combine with positive funding rates
Execution Strategy:
Wait for a breakout on around 2x average volume
Target the 261.8% Fibonacci extension
Take partial profits at psychological resistance levels
Place stops below the lowest trough
Confirm with on-chain accumulation data
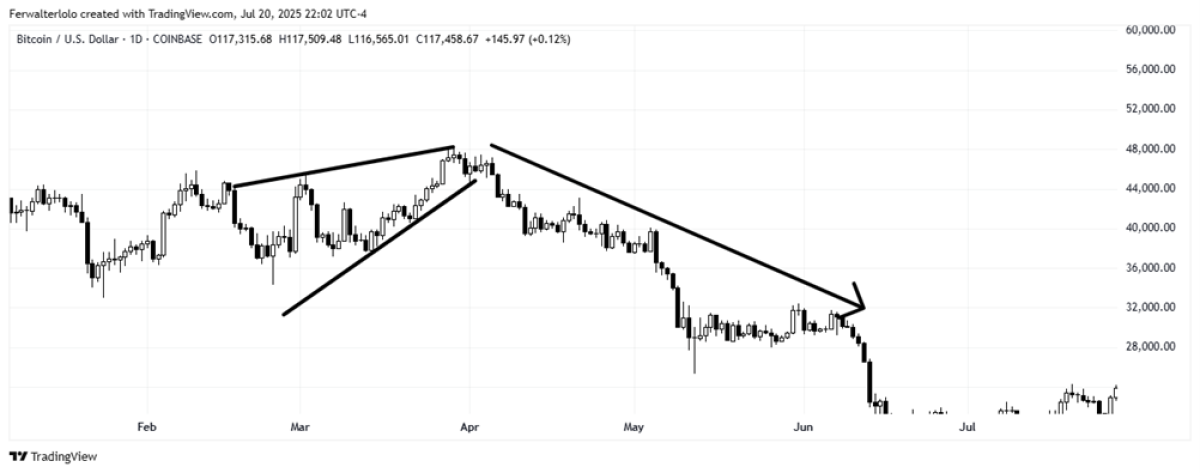
7. Ascending Wedge (Bearish Continuation/Reversal)
The ascending wedge is a bearish pattern that breaks downward 70% of the time in cryptocurrency markets despite its upward slope, signaling a bull trap. It forms as price makes higher highs and higher lows within a narrowing channel, signaling weakening momentum and buyer exhaustion. The breakdown typically occurs between 60-75% of the pattern’s completion, with the 50% Fibonacci retracement confirming the reversal. In crypto trading, ascending wedges frequently appear in overbought DeFi tokens or during late-stage bull runs.
Pros:
High-probability short setup
Clear breakdown points
Often leads to sharp declines
Cons:
It may experience fake breakouts
It requires volume confirmation
Crypto-specific Considerations:
Avoid trading during Bitcoin dominance shifts
Combine with decreasing open interest
Execution Strategy:
Short on confirmed breakdown
Place stop loss orders 1.5% above the pattern’s recent high
Target the 127% Fibonacci extension
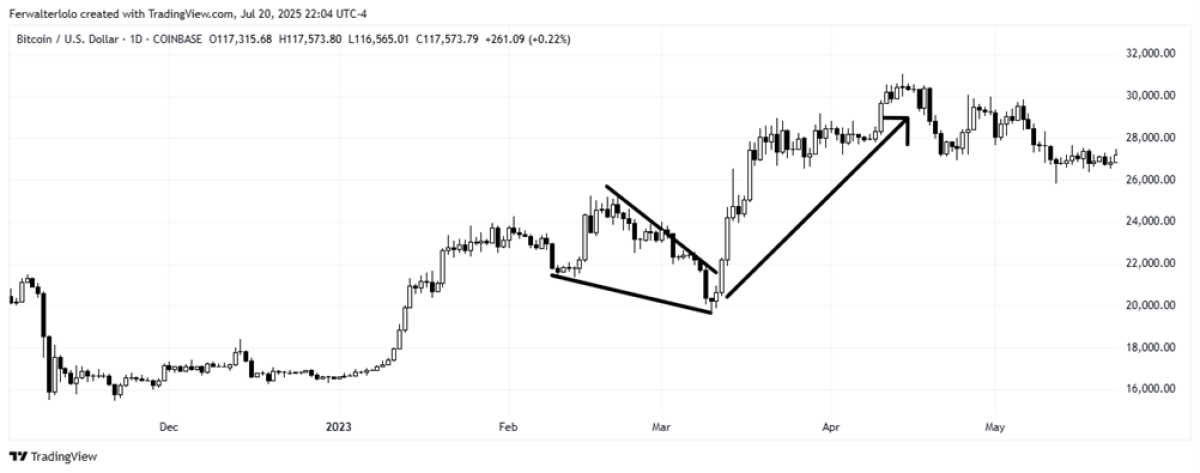
8. Descending Wedge (Bullish Continuation/Reversal)
The descending wedges pattern breaks upward 75% of the time, indicating a bear trap. It forms as price makes lower highs and lower lows within a narrowing channel, typically indicating selling exhaustion. The breakout often occurs between 60-75% of the pattern’s completion, near the 61.8% Fibonacci retracement, and with the 127.2% extension serving as an initial target. In crypto, descending wedges frequently appear before Bitcoin halving events or during accumulation phases.
Pros:
High win rate in bull markets
Clear breakout points
Often leads to strong rallies
Cons:
May break down in macro bear trends
Requires patience during formation
Requires volume confirmation
Execution Strategy:
Enter long positions on confirmed breakout
Target the 161.8% Fibonacci extension
Place stop-loss orders below the lowest trough
Take partial profits at previous resistance point
Combine with spot volume increases
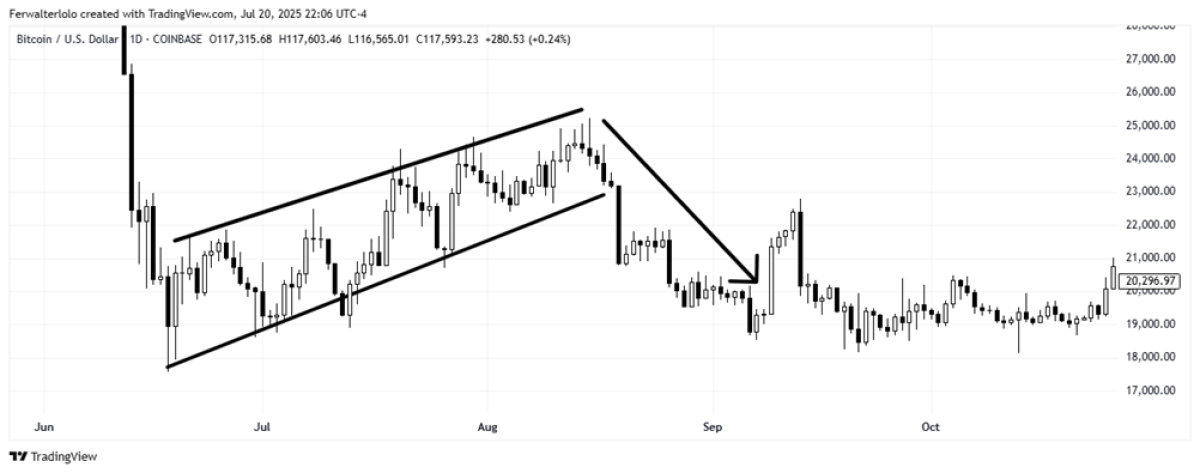
9. Ascending Flag
The ascending flag is a powerful bearish pattern, with a success rate of approximately 70%. It forms as a brief consolidation then following a sharp price advance, creating a visual “flag” attached to a steep “flagpole.” This structure reflects temporary profit-taking before the prevailing uptrend resumes. In crypto markets, ascending flags often appear during strong altcoin rallies or explosive upside Bitcoin moves. The shallow retracement (typically 25–38% of the flagpole’s height) signals that buyers remain in control, stepping in quickly on minor dips.
Key characteristics:
Flagpole: Near-vertical price decline with 150–300% above-average volume
Flag: parallel channel with 2–4 minor swings, forming over 5–15 periods on contracting volume (40–60% below average)
Breakout: Occurs on expanding volume (100–200% above average)
Retracement: Ideally 25–38% of the flagpole; should not exceed 50%
Ascending flags appear frequently during altcoin seasons when capital rotates from Bitcoin to alternative cryptos. It often forms after positive protocol upgrades, partnership announcements, exchange listings, and it is more reliable in high-liquidity cryptocurrencies (top 50 by market capitalization) than low-volume altcoins. It works exceptionally well on 4-hour and daily charts in crypto markets, and it is most reliable during strong bull markets and high-risk appetite environments.
Most common failures and risks:
Fake breakouts
Excessive retracements,
Volume divergence
Pattern failure during Bitcoin dominance spikes or broad market corrections
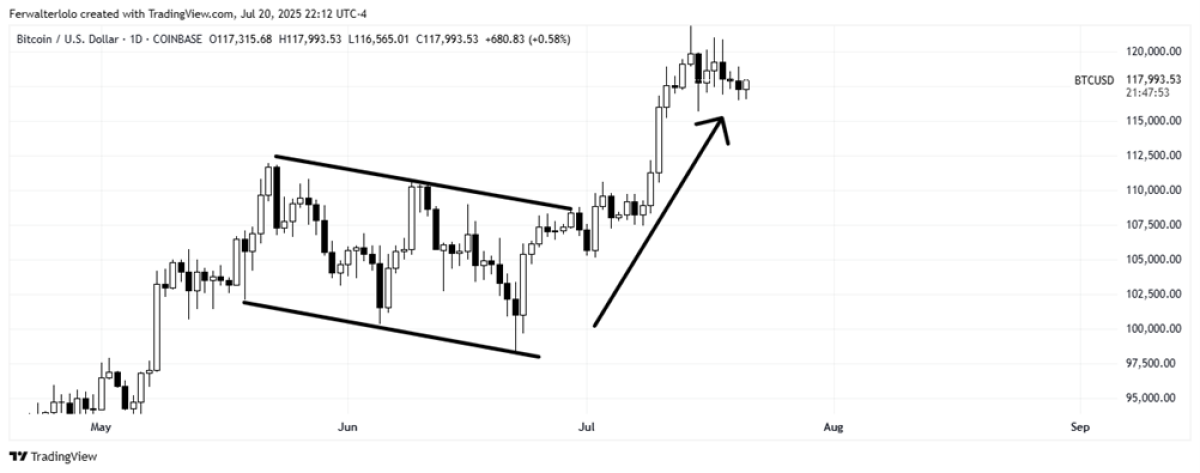
10. Descending Flag
The descending flag pattern serves as the bullish counterpart to the ascending flag. Descending flags form in downtrends, with a success rate of 70%. It forms as a brief, upward-sloping consolidation following a sharp price decline—creating a visual “flag” attached to a steep “flagpole.” This structure reflects temporary buying or short covering.
In cryptocurrency trading, descending flags frequently emerge during bear markets, liquidation events, or when major cryptocurrencies experience sharp corrections. The pattern indicates brief profit-taking by short sellers or temporary buying from value seekers, but ultimately shows that selling pressure remains dominant. The relatively shallow retracement (typically 25-38% of the flag pole's decline) demonstrates that sellers quickly reemerge at higher prices.
Key characteristics:
Flagpole: Steep price with 200–400% above-average volume
Flag: parallel channel with 2–4 minor bounces, forming over 5–12 periods on contracting volume (30–50% below average)
Breakdown: Occurs on expanding volume (150–250% above average)
Retracement: Ideally 25–38% of the flagpole; should not exceed 50%
Market Context:
Common during crypto winters and prolonged downtrends
Often precedes cascading liquidations in leveraged positions
More reliable when Bitcoin leads the market lower
Frequently correlates with stablecoin outflows and negative funding rates
Common failure modes and risk factors:
Bear trap scenarios
Failure if retracement exceeds 50% of flag pole
Lack of volume confirmation on breakdown reduces reliability by around 35%
Frequent failure during sudden positive news or market reversals
In conclusion, chart patterns are a cornerstone of technical analysis, offering traders a structured way to interpret market psychology and anticipate future price movements and action. The cryptocurrency market is dynamic, where trading theses are validated or invalidated very rapidly. This market requires a thorough analysis across both traditional and alternative investments. By combining these chart formations with Fibonacci retracements and volume analysis, traders can improve their decision-making and risk management. While no pattern is 100% reliable, understanding their structure and success rates enhances trading accuracy. The next article examines more advanced patterns and confluence strategies that combine multiple technical elements for higher-probability setups, along with the integration of other metrics and technical analyses.
About the Contributor
Fernando Walter Lolo, CAIA specializes in alternative investment, cryptocurrencies, volatility, and global-macro trading and investment strategies. Fernando has a strong track record to strategize, articulate, and execute investment strategies, financial operations, and trading in developed and emerging markets.
Learn more about CAIA Association and how to become part of a professional network that is shaping the future of investing, by visiting https://caia.org/