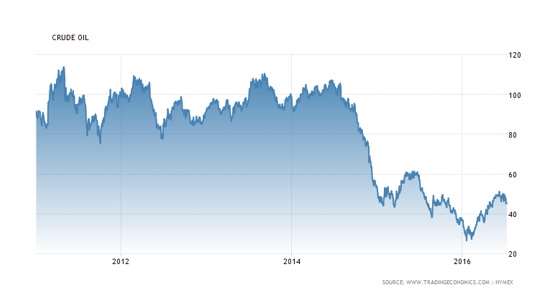
 As this year began, crude oil prices were stuck at their lowest level in twelve years. The world seemed to be bulging with surplus of the stuff. In January, the International Energy Agency estimated that the excess of supply over demand through the first half of the year would be 1.5 million barrels per day.
Since then, of course, the first half has gone into the record books, and the IEA now says the true figure was much lower, about 0.8 m b/d, though there are still “all the usual caveats about data revisions to come.”
This is an astonishing change and it is worth pausing over it. Near half of the apparent surplus of oil at the start of the year as projected for the first half, was an optical illusion.
On the Supply Side
This illusion has the usual two components, supply and demand. As Alfred Marshall once said, a parrot could be taught to be a competent economist, it need only be taught those two words.
On the supply side, crude supply took a couple of big hits: in Canada and in Nigeria. Terrible forest fires in the oil-sands region have cut into Canada’s oil production this year, with some companies evacuating staff from facilities threatened by the blazes. The Nigerian losses have more than offset increases in Middle Eastern outputs.
The good news, meanwhile, is from Iran, where the deal lifting proliferation-related sanctions has produced a thus-far muted version of what was surely one of its intended effects. The gain to the world oil markets has worked out to 700 thousand barrels a day. Better than nothing for businesses and industries dependent on the stuff, but not a game changer. Overall OPEC output is down.
In Nigeria the problem is a political rebellion, specifically a group calling itself the “Niger Valley Avengers,” sabotaging oil production. Nigeria’s budget targets oil production at 2.2 million barrels per day. Due to the Avengers, the actual production has been only 60% of that: 1.4 million barrels.
On the Demand Side
Meanwhile, on the demand side, the growth rate is larger than had been expected, mostly due to the requirements of nations outside the Organization for Economic Cooperation and Development. Global oil demand for the first quarter of this year was 1.6m b/d.
A ramp-up in demand can reasonably be expected because refineries are finally getting some much-due maintenance work done. Refinery throughput will increase by about 2.3m b/d quarter on quarter.
The United States, meanwhile, has entered its peak driving season. That does not amount to a new source of pressure on demand, because, after all, it is normal seasonal variation, and gasoline inventories are above last year’s – as well as above average years – levels as the season begins. “There is a similar picture in China,” says the IEA.
The over-all impression conveyed by the IEA’s data is of an oil market in balance, where no explosive price moves in either direction can be expected. But the oil price bottoms, below $30 a barrel established earlier this year, will remain the bottoms – it does not appear that they will be revisited.
How to Play This: One Idea
Assume that all of the foregoing is uncontroversial. One obvious question it raises is: what’s the best way for traders or investors to play this news?
One approach: bet on the rig count. Baker Hughes, a supplier of oil field services, does a weekly census of ”the number of drilling rigs actively exploring for or developing oil or natural gas in the United States and Canada,” that is, the rig count. It provides numbers broken down both by month and by week.
The recovery of oil from the $30 depth, and the continued equilibrium state of the market for that commodity, spell an upward rig count, as efforts to locate oil and bring it to the surface are sensitive to the market value of the stuff. That in turn amounts to good news for all the businesses that offer products or services to the rigs and their operators.
In May 2016 there were 424 rigs operating on land in the U.S. and Canada, 26 operating offshore. For June, the offshore number is down (to 21), but the land rigs have increased to 459, bring the total rig number for North America up from 450 to 480.


