


By Rob Croce, PhD – Managing Director and Portfolio Manager at Mellon & Aaron Filbeck, CAIA, CFA, CIPM – Associate Director of Content Development at CAIA Association
In 2000, United States 10-year government bonds rates were 6% and the median U.S. public pension plan had an actuarial return assumption of 8%. Because bond yields were almost as high as the actuarial target return, there was little headwind to meeting return objectives; depending on the funding status, many pension funds could achieve actuarial return objectives simply by investing most or all assets in government fixed-income securities. Since that time, government bond rates have fallen more than five percentage points, largely driven by the decline in inflation and market perception that the risk of future inflation remains low, while the median actuarial return assumption for U.S. public pension plans only fell 75 basis points from 8% to 7.25%. The takeaway: the allocation that one would use to target 7.25%[1] today will be very different from the one used to target 8% 20 years ago.
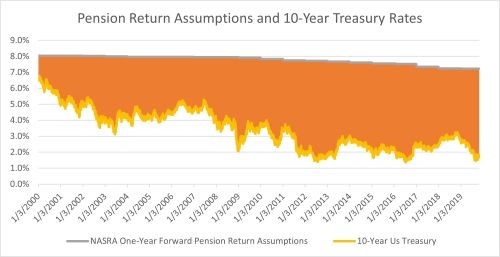
Figure 1: Difference Between Average Plan Actuarial Return Assumption and 10-Year US Treasury Yield
Source: NASRA, Bloomberg, CAIA calculations
As the gap widened, U.S. pension funds have tried to adapt their asset allocations accordingly, most notably by allocating less to safe-havens like fixed income and more to equities and, eventually, alternative investments. According to Public Plans Data, from 2001 to 2009, the average pension allocation to alternative investments increased from 8.7% to 15.7%, which only accelerated after the Global Financial Crisis (GFC). Over the next decade, allocations to alternatives nearly doubled, reaching nearly 27% by the end of 2019.
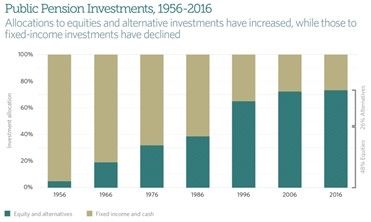
Figure 2: Average Allocations for the 73 Largest State-Sponsored Pension Funds
Source: Pew Research. Data as of 2016
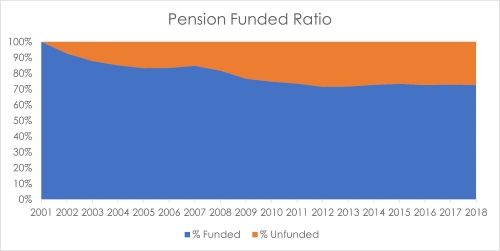
Figure 3: Average Pension Funded Status Across Pension Plans Included in the PPD (Public Plans Database)
Source: PublicPlansData.org. Data as of 2018.
Today, valuations across risk assets, public and private, are near historical highs. Underfunded pension plans need to find a way to increase their funded status and generate an attractive return to match lofty actuarial assumptions moving forward. In general, pension trustees seem to be faced with two potential solutions – take on more (or differentiated) risks or improve funding statuses through higher taxation or slashing benefits.
The Asset Allocation Decision: All Else Constant
For our purposes, let’s focus on the first potential solution—filling the gap through risk taking. Even as risk-free rates—or the amount you can earn holding risk-free short-term U.S. government debt—have fallen, actuarial return assumptions have barely moved. Therefore, that return gap must be filled by something else, which tends to lead these investors to additional risk taking to achieve a target rate of 7.25%.
In what follows, we analyze asset allocations and their viability to achieve 7.25%, starting from a policy portfolio that is composed of 60% domestic stocks and 40% U.S. 10-year bonds as a framework for considering additional asset allocations with different risk characteristics.
For this exercise, we used forward return expectations generated from looking at a very long history of equity and bond returns.[2] Since 1928, stocks have outperformed the risk free asset by 6.2% at 20% volatility and 10-year U.S. government bonds have outperformed the risk-free asset by 1.5%, for Sharpe ratios of 0.3 and 0.2, respectively. For cash, we have decided to use its current near-zero return, rather than its 3.3% average return during that period.
With those return expectations, our policy portfolio of 60% stocks and 40% bonds is expected to outperform cash by 4.9% with volatility of 12%, but still comes up short for our return target. Cash returning zero means there is effectively no unlevered portfolio of stocks and bonds that can reliably deliver many investors’ 7.25% target return over time. Because of the nature of the problem, the solution will likely force pension investors to consider taking on leverage. Some have embraced leverage to much controversy but, faced with the realities of capital markets and current funded statuses, it would not be surprising to see wider adoption of such practices. While shoring up underfunded statuses through taxation, or even slashing promised benefits, could be a potential option, they are both rather unpopular solutions. Investment committees cannot hope for the best and must deal with the realities they face today.
If we think the future is likely to look like the past, then achieving a 7.25% return objective would require levering the stocks and bonds in our policy portfolio by 47%, increasing portfolio volatility to 17.75%. Problem solved for pension managers? Not quite. In bad times, a portfolio volatility of 17.75% will be very painful for entities funding benefits. In addition, during good times there will likely be pressure for permanent benefit increases that, when bad times inevitably arrive, will no longer be practicable and will sink funded ratios even further. Adjusting this analysis to account for the current (high) valuation levels would only make the concerns raised prove even truer. This is a new problem, and investors must think outside the box in order to solve it.
Enter the potential role of alternatives. But, which alternatives are likely to improve upon the situation just described? For pension funds, it’s any alternative that can increase the portfolio’s probability of hitting its targeted return at or below the 17.75% volatility of the levered policy portfolio. It’s worth noting we’ve chosen to measure risk using volatility because we’ve found that most definitions of risk are linearly related and differences are largely semantics. Let’s compare two hypothetical alternative allocations as potential solutions for U.S. pension funds to hit their 7.25% return, one illiquid and the other liquid.
- Example 1: Illiquid (Private Equity). Let’s assume a median private equity portfolio exhibits a risk/return profile of a portfolio levered to the S&P 500® two-to-one. The portfolio reports smoothed returns, providing the investor with a perceived risk 75% lower than the economic risks embedded in the portfolio (we’ve discussed the issues of return smoothing in prior posts). Before fees, the expected net[3] return of the hypothetical portfolio is 10.4% with 10% stated volatility, though the economic risk would suggest a 40% volatility. On paper, this helps achieve the goal of 7.25% return with less than 17.75% perceived volatility, but we know the economic risk is far greater. Additionally, most retirement portfolios need to maintain some liquidity, which makes this even more challenging, especially if institutions are forced to sell at much lower values than the appraised value. Otherwise, our asset allocation work would be done and the quants could go hit the golf course.
- Example 2: Liquid (Hedge Funds or Diversifying Assets). To meet the criteria for adding value to the portfolio, an additional liquid diversifying strategy should have correlation < 1.0 to the funding source and generate return of at least 7.25%. One can potentially accomplish this objective through a more efficient portfolio of liquid assets (g., risk parity, or an alternate strategic allocation the investor believes is more beneficial to the levered 60% stock, 40% bond portfolio on a risk-adjusted basis). Once again, however, in a world where most beta sources are likely to generate returns lower than the target, any alternative will likely require leverage and introduce more potential tracking error to the liabilities trustees are trying to match. If we think risk parity portfolios can generate Sharpe ratios of over 0.6, then a risk parity portfolio to 12% target risk should achieve the objective of similar return with 5% less risk than levering the 60% stock 40% bond portfolio.
While these two examples provide different solutions for the same problem, there are many strategies that don’t make sense for investors. Namely, anything that takes them further from their return target for the sake of diversification or anything illiquid with an expected return below their target portfolio return. In the first case, that means those high Sharpe alpha strategies with 3% volatilities face a headwind, especially without leverage. Even if they reliably generate 2x Sharpe ratios, expected returns still don’t meet the cutoff. While you could deploy some of them as portable alpha strategies, underlying them with futures, there is a natural limit to how much and how successfully this can be implemented. The reality is when rates were 3.3%, these strategies would have added a lot of value to respective portfolios, but with rates on the floor, it make it impossible to “eat risk-adjusted returns.” Simply, investors should be wary of exhausting their entire illiquidity appetite on beta exposure when there might be more attractive liquid beta strategies available.
What we know is that buying bonds isn’t going to cut it from a return target perspective today, and what we’ve demonstrated here is that in order to achieve the return they need to meet their funding obligations, pension managers will be forced to use leverage. But, it’s not as simple as levering up and letting the good times roll. And while each pension fund is different, risk tolerance and liquidity needs will need to be managed.
We think that the current, low yield environment could potentially open institutions up to the idea of using low-risk liquid absolute return strategies as substitutes for fixed income investments. We believe they will increasingly look for investments that provide portfolio stability values and some diversification during risk-off environments, similar to that of traditional fixed income, but potentially provide the return of fixed income two decades ago.
Dealing with the Realities of Today
While this article focused primarily on the portfolio construction decision, holding all else constant, the reality is that asset allocation decisions can only do so much, and pensions face some very tough decisions in the future, regardless of where they invest capital. The gap between government bond rates (once able to achieve pension objectives on their own) and actuarial return assumptions is wider than ever. In the absence of exogenous changes, pension managers will be forced to make significant asset allocation shifts, take on leverage, and/or find other creative ways to achieve these lofty return targets. It’s true that not every portfolio needs to allocate to every asset class at their disposal, as some investors may be better off avoiding certain asset classes completely, especially if they don’t align with the objectives of the overall portfolio or their areas of due diligence expertise. However, they must do something to boost returns, and increasing their tolerance for risk and illiquidity seems to be the pathway forward.
Disclosure
Mellon Investments Corporation (“Mellon”) is a registered investment advisor and subsidiary of The Bank of New York Mellon Corporation (“BNY Mellon”). Any statements of opinion constitute only current opinions of Mellon, which are subject to change and which Mellon does not undertake to update. This publication or any portion thereof may not be copied or distributed without prior written approval from the firm. Statements are correct as of the date of the material only. This document may not be used for the purpose of an offer or solicitation in any jurisdiction or in any circumstances in which such offer or solicitation is unlawful or not authorized. The information in this publication is for general information only and is not intended to provide specific investment advice or recommendations for any purchase or sale of any specific security. Some information contained herein has been obtained from third party sources that are believed to be reliable, but the information has not been independently verified by Mellon. Mellon makes no representations as to the accuracy or the completeness of such information. No investment strategy or risk management technique can guarantee returns or eliminate risk in any market environment and past performance is no indication of future performance. The indices referred to herein are used for comparative and informational purposes only and have been selected because they are generally considered to be representative of certain markets. Comparisons to indices as benchmarks have limitations because indices have volatility and other material characteristics that may differ from the portfolio, investment or hedge to which they are compared. The providers of the indices referred to herein are not affiliated with Mellon, do not endorse, sponsor, sell or promote the investment strategies or products mentioned herein and they make no representation regarding the advisability of investing in the products and strategies described herein. Please see mellon.com for important index licensing information.
Targets are objectives, are provided for illustrative purposes, are subject to change and should not be construed as providing any assurance as to the results that may be realized in the future.
[1] The 7.25% target referenced throughout the piece is the pension plan actuarial rate of return, which is an accounting identifier that equates assets to liabilities. These rates are not rates of return and are not net of any fee.
Targets are objectives, are provided for illustrative purposes, are subject to change and should not be construed as providing any assurance as to the results that may be realized in the future.
Excess returns of stock and 10 year bonds are calculated by subtracting Treasury bill returns. Excess Stock Return = Stock Return – T-Bill Return. Excess Bond Return = Bond Return – T-Bill Return.
[3] Net of a 2% management fee but gross of the incentive fee that is typically in PE. The gross return is 2X the equity excess return assumption stated above or 12.4%. We then assume the incentive fee cancels out the alpha perfectly. So we are left with 10.4 net of both fixed and incentive fee.
The portfolios presented above are used for illustrative purposes only and do not represent actual portfolios or the performance of actual portfolios.