By Zack Ellison, CFA, CAIA and Guy Pinkman, CPPT
The Worsening Pension Funding Gap
The most important measure of a pension’s health, and its ability to provide for its constituents, is its funded status. Funded status is measured by subtracting the pension’s projected benefit obligation (“PBO”) from its assets. The PBO is a complex actuarial measurement, involving many assumptions, that estimates the present value of liabilities. Funded level (often referred to as “funding” level) is a related ratio that results from dividing a pension’s assets by its PBO. What is the appropriate funding level for a pension? In theory, every plan should be 100% funded. However, as the legendary Yogi Berra once quipped, “In theory there is no difference between theory and practice. In practice there is.” S&P Global Ratings looks at the three-year average pension funded ratio and considers anything less than 80% to be “relatively low”.[1] Meanwhile, Fitch Ratings “generally considers a funded ratio of 70% or above to be adequate and less than 60% to be weak.”[2]

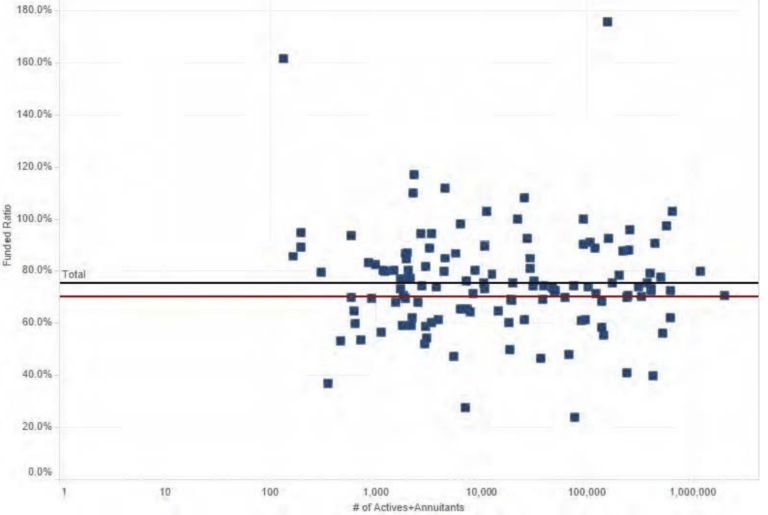
The consensus from practitioners is that the “magic” number for funding levels is 80% or higher. This 80% figure is rooted in historical legislation. As the United States Government Accountability Office noted in a 2008 report:[3] "The Pension Protection Act of 2006 provided that large private sector pension plans will be considered at risk of defaulting on their liabilities if they have less than 80 percent funded ratios under standard actuarial assumptions and less than 70 percent funded ratios under certain additional ‘worst-case’ actuarial assumptions. When private sector plans default on their liabilities, the Pension Benefit Guaranty Corporation becomes liable for benefits." Pensions funded below the 80% threshold begin to be heavily scrutinized and are often viewed as "struggling”. Pensions at 80% or above tend to be left to operate in relative peace. In 2020, public pension funding levels stood at 75% on average, according to the benchmark 2020 NCPERS Public Retirement Systems Study, conducted by the National Conference on Public Employee Retirement Systems and Cobalt Community Research. Many public pensions are woefully underfunded with roughly half operating with a funded level below 80% (as demonstrated in the distribution below). Many private pensions are not better off. As the Pension Benefit Guaranty Corporation (“PBGC”) noted in its 2020 annual report, although its Single-Employer Program had assets of $143.5 billion versus liabilities of $128.0 billion as of September 30, 2020, the program’s exposure increased to $176.2 billion in underfunding in pension plans sponsored by financially weak companies that could potentially become claims to PBGC.[4] More jarring is the financial condition of PBGC’s Multiemployer Program, which remains on the path toward insolvency. It remains severely underfunded with liabilities of $66.9 billion but only $3.1 billion in assets as of September 30, 2020, and the PBGC projects that it will be insolvent in 2026.[5]
Funded Ratios of U.S. Public Pensions in 2020 (NCPERS Public Retirement Systems Study)
Pensions are not only underfunded, but they are also likely to become more underfunded given their lofty assumed rate of return and their current asset allocation mix. A huge risk to investment performance, and funded levels, becomes apparent as we dig a little deeper. For pensions to prevent a further decline in funded status they need to achieve their average assumed rate of return, which in 2020 stood at 7.26% on average. However, given that public pensions are substantially overweight International Fixed Income (Actual was 28.6% above Target in 2020) and Global Fixed Income (Actual was 8.2% above Target in 2020), there is a pronounced risk that investment performance will not meet targeted assumed rates of return for many pensions.
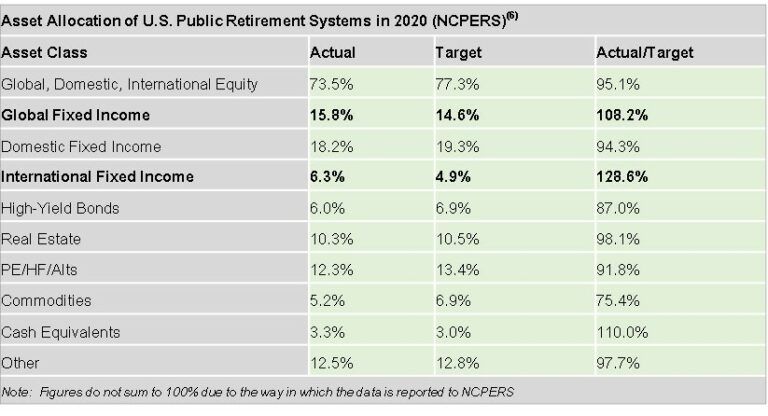
Why is the overweight in international and global fixed income problematic? Fixed income performed very well in 2020 due to massive global monetary stimulus meant to combat the negative economic effects of the COVID-19 pandemic. As central banks flooded the market with liquidity, interest rates fell substantially across the globe. The benchmark 10-year U.S. Treasury yield fell from 1.92% at YE2019 to 0.93% at YE2020. Concurrently, the 10-year benchmark yields on government debt issued by Canada, England, Australia, and Germany declined by 1.03%, 0.63%, 0.40%, and 0.38%, respectively, over the course of 2020.

Thus, as interest rates fell, bond prices rose in 2020 and pensions benefited from this rally in fixed income. Performance was borrowed from the future to support this short-term rally. A future risk cliff now exists given that “what goes down, must go up” in the world of interest rates – gravity does not apply. Rates cannot fall much further (i.e., how much more are investors willing to pay to hold bonds with negative yields?) and an eventual move higher will lead to steep declines in fixed income performance. When will this happen? It is impossible to know. Mr. Berra would tell us “it’s tough to make predictions, especially about the future.” However, we can make probability-adjusted assumptions about the future and all the evidence points to underperformance for public fixed income, such as government bonds, commercial mortgage-backed securities (“CMBS”), and corporate bonds, given the interest rate risk and heightened credit risk arising from the continuing global pandemic. Currently, the iShares Core U.S. Aggregate Bond ETF, an investable proxy for U.S. aggregate bond performance, has a weighted average yield to maturity of only 1.09% across 8,413 holdings.[7] That means that if risks do not materialize – i.e., interest rates and credit spreads do not increase – investors will only earn a bit more than a penny for every dollar they invest in U.S. public fixed income this year.[8]
It gets worse. With an effective duration of 6.0, a back-of-the-napkin calculation indicates that even a 0.20% increase in yield (irrespective of whether it comes from an increase in interest rates or credit spreads) will wipe out all gains in U.S. aggregate fixed income for the year. Thus, it will not take much for investors in public fixed income to lose money. Similar logic holds for most international markets, many of which are even worse-off. Howard Marks, Co-Chairman of Oaktree Capital Management, stated in a Financial Post article from December 30, 2020 that “rising interest rates, unlikely as they are in the intermediate term, are the main threat [to fixed income performance]”. Scott Minerd, Global CIO of Guggenheim Partners cautioned in the same article that “beyond the eyewall lies a poor credit environment judging by credit defaults, rating migration, and corporate fundamentals. In aggregate, the high-yield (debt) market has 4.5 times more debt than last 12-month earnings before taxes and other items, a ratio that already exceeds the 2008-2009 default cycle peak, and is likely to worsen from here.”[9] Public fixed income returns are not so “fixed” when all the risk is skewed to the downside. This has left pensions, and other institutional investors, in a pickle as they strive to achieve return targets in a low yield environment while protecting against rising interest rates and widening credit spreads.
A Possible Solution: Private Debt
As pensions seek to meet their targeted returns to keep from falling into larger deficits, one attractive investment solution is private debt, specifically direct corporate loans to middle market and lower-middle market companies. These loans typically yield 6-12%, have floating rate coupons, and short maturities (five-to-seven-year terms that are paid down in three years on average). Loans are most often senior secured with a 1st lien on all borrower assets. Direct loans possess many features that are attractive to pension investors:
- High risk-adjusted returns
- Attractive current cash income
- Portfolio diversification
- Capital preservation
- Inflation/Interest rate protection
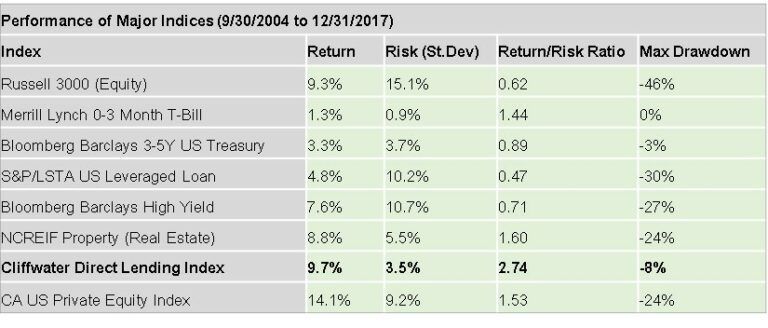
In the case of direct loans, performance in practice exceeds theoretical expectations. From 9/30/2004 through 12/31/2017, U.S. middle market direct loans generated annual income of 11.2%. Net of all (un)realized gains and losses, total return equaled 9.7% during this period.[10] Using standard deviation as a proxy for risk, direct loan risk-adjusted performance was far superior to equities, government bonds, leveraged loans, high-yield bonds, real estate, and private equity. Furthermore, the maximum drawdown in direct loans during this period was only -7.7% in 2008 during the Global Financial Crisis. This drawdown was far better than the next best performing risk assets – real estate and private equity – which both suffered a 24% drawdown.
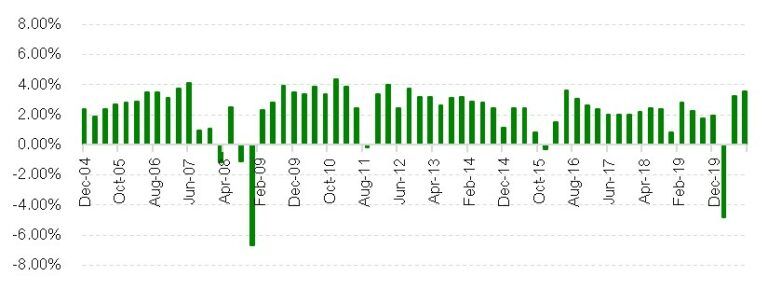
Recent performance of direct loans has been solid. Q1 2020 results (-4.84%) were negatively impacted by the massive uncertainty of the burgeoning COVID-19 pandemic but returns thereafter have been strong at 3.25% in Q2 2020 and 3.53% in Q3 2020, respectively. The asset class is up 1.72% through Q3 2020 and all indications are that strong Q4 2020 numbers will lift performance to more than 5% for FY2020. An underappreciated benefit of private direct loans is the consistency of returns. Dating back to 2004, quarterly returns have been positive 91% of the time in 58 of 64 periods. Three of the six periods of negative returns occurred in 2008, one was in Q1 2020 when COVID fears were peaking, and the other two were very small in magnitude during periods of heightened market volatility (-0.18% in Q3 2011 and -0.28% in Q4/2015). Average quarterly total return was 2.24%, with average quarterly income return of 2.64%, allowing for the powerful effects of compounding through multiple market cycles.[11]
Quarterly Performance of U.S. Direct Middle Market Loans (Cliffwater Direct Lending Index)
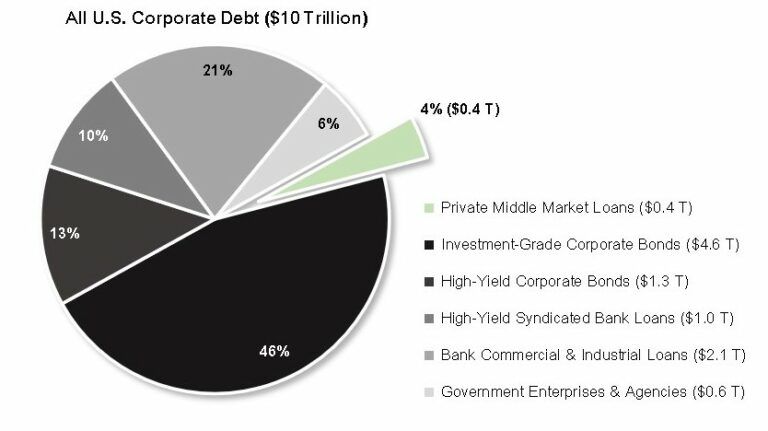
Fortunately for pensions that require performance benchmarks, the Cliffwater Direct Lending Index ("CDLI") measures the unlevered, gross of fees performance of U.S. middle market corporate loans, as represented by the underlying assets of Business Development Companies ("BDCs"), including both exchange-traded and unlisted BDCs. The CDLI is an asset-weighted index that is calculated on a quarterly basis using financial statements and other information contained in the U.S. Securities and Exchange Commission ("SEC") filings of all eligible BDCs. The index has a base date of September 30, 2004 and captures the performance data through the Global Financial Crisis of 2008 to 2010 as well as performance during the (ongoing) COVID pandemic that began in 2020.[12] The U.S. corporate debt market is approximately $10 trillion in size. Direct middle market loans represent approximately 4% of this total, equating to $400 billion.[13]
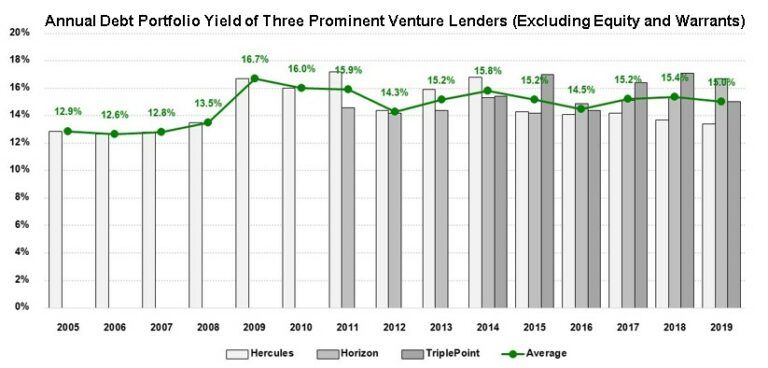
In addition to direct private middle market loans there are many private debt sub-strategies that offer further diversification benefits and, in some cases, outsized risk-adjusted premiums. Pensions can feast on a smorgasbord of options that includes: Real Estate Debt, Mezzanine Debt, Collateralized Loan Obligations (“CLOs”), Asset-Based Loans, and Venture Debt, among others. The venture debt strategy has been quickly gaining recognition from pensions for its ability to produce outsized returns with surprisingly low risk. Venture debt includes debt products for companies (typically Series B, Series C, and Series D technology companies) that have previously received substantial institutional funding from venture equity investors. The debt is typically structured in the form of short duration, floating-rate senior secured term loans combined with equity warrants. This mix provides investors with current income, capital protection, and unlimited potential return. In a market segment with many attractive options, venture debt may have the highest risk-adjusted return of any private debt strategy over the past 15 years. Applied Real Intelligence (“A.R.I.”) estimates that non-bank venture debt lenders returned over 20% annually from 2005 to 2019, a period that includes the worst years of the Global Financial Crisis during 2008 to 2010. These returns are achieved through a combination of interest, fees, and equity exposure (via warrants). Interest is typically a floating rate (e.g., Prime Rate + credit spread) that is paid in cash on a quarterly basis. Fees typically include those received by the lender at the time of initial loan underwriting (“upfront” fees) and at time of loan repayment (“backend” or “success” fees). Equity warrants are likely to be monetized when a portfolio company has a positive liquidity event, such as being acquired or going public via an initial public offering (“IPO”). While the performance of many venture lenders is private, a good proxy for performance is provided by publicly available data from three of the most prominent venture debt-focused BDCs: Hercules, Horizon, and TriplePoint. From 2015 through 2019, the average annual debt portfolio yield for the group was over 15%, excluding equity and warrants. While it is too early to know what the equity positions will be worth from these recent vintage years, A.R.I. estimates that over time they will add another 3% to 6% to annualized return.[14]
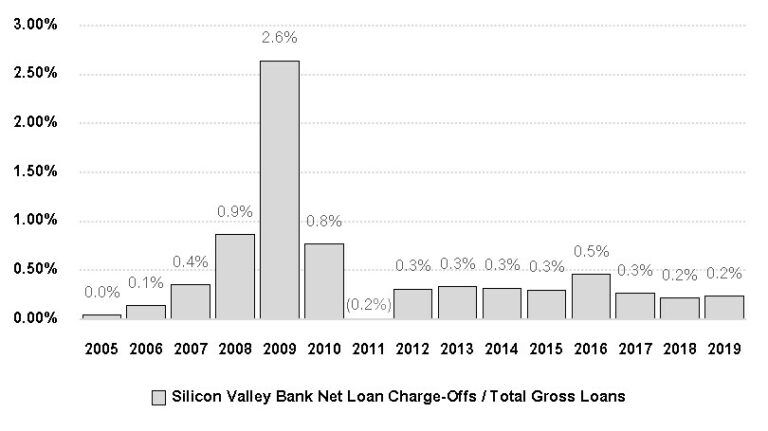
A conservative estimate of annual historical loss rates across all venture lenders is 0.25% to 0.50%. Hercules Capital, the largest publicly traded BDC focused on venture debt, had effective annualized losses of just 0.04% on over $11 billion of capital deployed from 2005 to Q3/2020. Meanwhile, Silicon Valley Bank, the largest publicly traded bank focused on venture debt, had loan losses averaging less than 0.50% from 2005 to 2019.[15]
Annual Loan Losses of the Largest Venture Debt Lender: Silicon Valley Bank
Part of the reason for venture debt’s success lies in the inefficiency inherent in the early-stage lending market and the relatively small size of the asset class, which heretofore has kept it off the radar of many large pension investors. However, venture debt grew nearly 30% year-over-year in 2020 to $18 billion and A.R.I. expects it to grow to as much as $25 billion by the end of 2021.
It's Not Too Late for U.S. Pensions Pensions remain significantly underfunded and risks continue to build in their investment portfolios, particularly within public fixed income. Although there is no quick fix or easy way out, private debt offers a potential reprieve that pensions can act on near-term to improve investment returns and chip away at their funding deficits. Our neighbors to the north in Canada, typically regarded as the model of a well-run pension system, have already begun seizing upon the opportunity. As a Wall Street Journal article from October 2, 2020 stated: “Canadian public pension funds scooped up private debt as market upheaval from Covid-19 left borrowers willing to offer appealing terms. Their private debt allocations ticked up more than 5% to $46.9 billion between Dec. 31 and Sept. 20, according to Preqin data. It was the biggest increase in percentage allocation in five years, from about 3% of total fund holdings to 4%. Unlike the publicly traded bonds that have been a staple of pension fund portfolios for decades, these investments typically consist of private loans made to companies, either by a pension fund directly or through an investment manager.” The article further states that, “the increase in private debt is part of a larger push by U.S. and Canadian pension funds into privately held investments coveted for their high projected returns. But U.S. pension funds’ overall private debt holdings have not grown during the pandemic, Preqin found.”[16] It is not too late for U.S. pension funds to follow suit and reap the benefits of private direct lending strategies. Leaving it to Yogi Berra for the last words: “When you come to a fork in the road, take it.”
About the Authors
Zack Ellison, CFA, CAIA Zack Ellison, CFA, CAIA, is the Managing General Partner and Chief Investment Officer of Applied Real Intelligence (“A.R.I.”). A.R.I. is a Los Angeles-based venture debt investment manager focused on providing financing solutions to innovative, high-growth, VC-backed companies in recession-resistant sectors and underserved regions in North America. Mr. Ellison leads A.R.I.’s investment activities, including sourcing, due diligence, structuring, execution, and portfolio management. Previously, Mr. Ellison was Director, U.S. Fixed Income at Sun Life Financial, where he was responsible for corporate credit investing. Prior to Sun Life Financial, he was a corporate bond and credit default swap trader at Deutsche Bank. During the Global Financial Crisis, he was a banker focused on leveraged loans within the media and telecom sectors at Scotiabank. Mr. Ellison is a frequent speaker at financial industry events, where he has presented his views on how companies and the financial markets need to innovate, adapt, and evolve to optimize risk and return. He has been a featured speaker at events hosted by CFA, CAIA, Risk Magazine, Euromoney, Bloomberg, TABB Forum, 100 Women in Hedge Funds, WBR’s Fixed Income Leaders Summit, and Private Equity Wire, among others. Mr. Ellison holds an MBA from The University of Chicago Booth School of Business and an MS in Risk Management from New York University’s Stern School of Business. He has earned the Chartered Financial Analyst (CFA) and Chartered Alternative Investment Analyst (CAIA) designations and currently serves as a Board Member of CFA Society Los Angeles and the Southern California Chapter of the CAIA Association.
Guy Pinkman, CPPT Guy Pinkman is a two-time Presidential Appointee to the Pension Benefit Guaranty Corporation’s Advisory Committee. The PBGC was created by the Employee Retirement Income Security Act of 1974 to protect the retirement incomes of over 34 million American workers in private sector defined benefit pension plans. He is also a member of the Advisory Board of Applied Real Intelligence (“A.R.I.”), a venture debt investment manager. Mr. Pinkman has served for over 12 years as a Trustee for the City of Lincoln Police and Fire Pension Plan Investment Board in Lincoln, Nebraska. In addition, he is a Captain/paramedic with the Lincoln Fire and Rescue Department. A firefighter for nearly 30 years, he has served as a Battalion Chief for over a decade. Captain Pinkman has been recognized by the Lincoln Fire and Rescue Department for over 25 life-saving Phoenix Awards, numerous citations of valor, and paramedic of the year. As a recognized speaker, trainer, and subject matter expert on public pensions, Mr. Pinkman has appeared at numerous colleges, universities, and conference seminars covering topics such as management, leadership, and fiduciary responsibilities. He has had the rare opportunity to speak at the Knesset in Israel, as well as the Tel Aviv Stock Exchange, on topics ranging from fiduciary responsibility to governance of Public Pensions. A graduate of the University of Nebraska-Lincoln, Mr. Pinkman holds a Bachelor of Science degree with an emphasis in Advertising and Public Relations.
References
- S&P Global Ratings. U.S. State Ratings Methodology. October 17, 2016.
- https://www.ncpers.org/Files/2011_enhancing_the_analysis_of_state_local…
- https://www.gao.gov/assets/280/271576.pdf
- Pension Benefit Guaranty Board Press Release. December 10, 2020.
- https://www.pbgc.gov/about/annual-reports/pbgc-annual-performance-finan…
- https://www.ncpers.org/files/ncpers-public-retirement-systems-study-202…. Note that average allocations in each asset class do not sum to 100% because of how individual allocations were reported.
- https://www.ishares.com/us/products/239458/ishares-core-total-us-bond-m…. As of February 16, 2021, the iShares Core U.S. Aggregate Bond ETF had 8,413 holdings, and a yield to maturity of 1.09%.
- The largest issuers in the iShares Core U.S. Aggregate Bond ETF as of February 16, 2021 are: United States Treasury (37.5%), Federal National Mortgage Association (10.3%), Government National Mortgage Association II (5.7%), Uniform MBS (5.5%), and the Federal Home Loan Mortgage Corporation (4.0%).
- https://financialpost.com/financial-times/what-can-go-wrong-investors-v…
- Nesbitt, Stephen. Private Debt: Opportunities in Corporate Direct Lending. John Wiley & Sons, 2019.
- Direct loan performance is measured by the Cliffwater Direct Lending Index (CDLI). http://www.cliffwaterdirectlendingindex.com/
- http://cliffwaterdirectlendingindex.com/
- Nesbitt, Stephen. Private Debt: Opportunities in Corporate Direct Lending. John Wiley & Sons, 2019.
- Ellison, Zack. Venture Debt – 10 Things to Know. Applied Real Intelligence LLC. January 22, 2021. https://www.applied-real-intelligence.com/insights/
- All loss data is from the audited annual reports of Silicon Valley Bank (NASDAQ: SIVB) and is calculated as net loan charge-offs/total gross loans for the period.
- https://www.wsj.com/articles/canadian-pensions-find-opportunity-in-priv…


