


By Stephen L. Nesbitt – Chief Executive Officer, Chief Investment Officer of Cliffwater.
Long-Term Private Equity Performance: 2000 to 20211
Press coverage of private equity focuses almost exclusively on second order concerns over disclosure, fees, layoffs, debt, and an occasional scandal. Rarely is attention given to the first order benefit of high risk-adjusted returns.
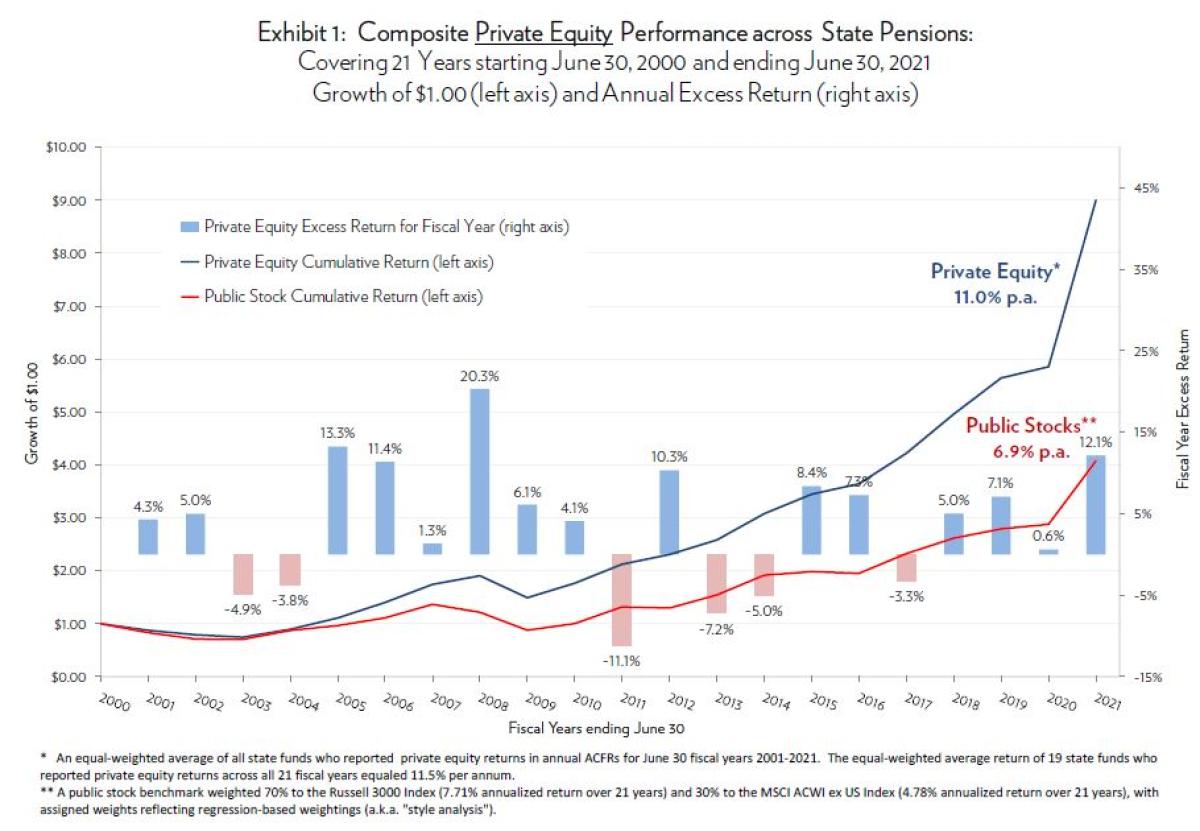
Our annual performance study now includes 20212, a year that produced an extraordinary 54% return for private equity, 12% better than the public stock markets. Over a 21-year time period ending June 30, 2021, private equity allocations by state pensions produced a 11.0% net-of-fee annualized return, exceeding by 4.1% the 6.9% annualized return that otherwise would have been earned by investing in public stocks. Thanks to compounding, the higher long-term return from private equity produces almost twice the investment gains over a 10-year period when compared to public equity.
The higher private equity returns did not come with higher risk. The annualized standard deviation of returns for private equity equaled 16.1% for the 21-year period, compared to 17.1% for public stocks.
Private Equity Performance
Exhibit 1 plots cumulative returns3 for the Private Equity Composite and Public Stock Benchmark. Annualized returns for the entire 21-year period are reported. The 11.0% annualized return for private equity for the entire 21-year period is impressive compared to the 6.9% annualized return for the Public Stock Benchmark and the resulting 4.1% annualized return difference exceeds the 3% annual premium or excess return generally associated with return objectives for private equity. Also shown in Exhibit 1 are bars representing individual fiscal year return differences (“excess returns”) between the Private Equity Composite and Public Stock Benchmark.
Study Data and Design
We draw our findings from data provided in Annual Comprehensive Financial Reports (“ACFRs”) published by 94 state pension systems. We select this data source because, unlike commonly used commercial universes, it is a closed group with no selection biases, and represents actual results achieved by large institutional investors. The list of 94 is narrowed to 65 state systems that use the same June 30 fiscal year-end date to achieve consistent performance measurement periods. The list is reduced again to 53 state systems that reported private equity returns for all or part of the study period. Nineteen (19) of the 53 state systems operated private equity portfolios for all 21 fiscal years.
The study period was selected partly for ease of data collection but also because it covers two full market cycles, encompassing two bear markets (fiscal years 2001-03 and 2008-09) and two bull markets (fiscal years 2004-07 and 2010-19) and one incomplete cycle (2020-21). We create a “Private Equity Composite” return series calculated by taking the average of all state systems reporting private equity portfolio returns for that fiscal year. The number of state systems included in the yearly average grew steadily over the study period from 19 to 53.
Most state systems have a private equity objective to outperform public equity by some percentage point amount, the most frequent amount being 300 basis points (3%), net of all fees. The 3% incremental return is intended to compensate investors for the loss of liquidity and complexity associated with private equity, but investors do differ on the appropriate return spread for private equity over public equity. The equity index used to represent public equity varies as well with some state systems targeting a U.S. benchmark like the S&P 500 or Russell 3000 Index and others using a global equity index like the MSCI ACWI Index. 4
We create a “Public Stocks Benchmark” by calculating a weighted average of the Russell 3000 Index (70%) and the MSCI ACWI ex US Index (30%), rebalanced annually. The 70% and 30% weights are, in our judgment, reflective of the typical mix of U.S. and non-U.S. private equity investments in large, diversified portfolios. The weightings are confirmed through a statistical analysis of periodic state pension private equity returns as dependent variable and the Russell 3000 and MSCI ACWI ex US index returns as independent variables. Regression coefficients on the Russell 3000 and MSCI ACWI ex US variables were found to be exactly 70% and 30%, respectively, indicating that our Public Stocks Benchmark best reflects the geographic risks found in private equity allocations.
The return calculations in this study follow the reporting practices of state pension systems as described in most ACFRs. Reported fiscal year private equity returns are typically internal rates of return, which are then linked in a time-weighted fashion to create multiperiod returns. The internal rate of return calculation is often used in measuring private equity performance in part because it represents a better measure of return when cash flows are very large in relation to portfolio values and because managers control the timing of cash flows. These two conditions are less relevant for state private equity portfolios that aggregate many underlying private equity funds. First, aggregated private equity cash flows (both inflows and outflows) tend to be modest relative to the size of the overall portfolio. Second, at the aggregate level the timing of cash flows is also controlled by the pension system itself through its “capital budgeting”. For example, a fund manager’s eagerness to distribute cash proceeds may be offset by increased new fund commitments by the pension system to preserve “vintage diversification”.
Convergence
A familiar narrative heard over the last few years is that private equity returns are failing to deliver the excess return over public stocks compared to years past.5 Our study finds no such evidence. Private equity returns are tested for convergence through a simple regression analysis that uses fiscal private equity excess returns reported in Exhibit 1 as the dependent variable and time as the independent variable. The resultant coefficient on time (year) is a tiny +1 basis point with no statistical significance at any level. Even casual inspection of the annual excess returns in Exhibit 1 would suggest no directionality over time. Convergence may be a legitimate investor concern, but there has been no evidence of its presence.
Strong performance from private equity is expected. Private asset classes, including private equity, private debt and private real estate, should outperform their public equivalents as investors demand higher returns for loss of liquidity. This “illiquidity premium” has generally been estimated at two percentage points in extra return across private asset classes.6
Conclusion
Our updated study focuses on the private equity performance achieved by large state pension systems over a 21 fiscal year period from 2000 to 2021. This data is different from return universe data available on individual private equity funds which ignores selection, weighting, co-investment, and other decision factors that state pensions make in managing a private equity portfolio.
The study finds that private equity produced a significant 4.1% annualized excess return over public equity. We test for any diminution of excess return over time and find no evidence of private equity and public stock return convergence.
Private equity has consistently been one of the strongest performing asset classes within state pension portfolios, which investment consultants expect to continue.
Footnotes:
1 This is the fifth edition of our private equity performance report, which was first printed in 2017.
2 Fiscal year 2021 from June 30, 2020 to June 30, 2021.
3 Cumulative returns are presented in Exhibit 1 using a “Growth of $1.00” scale, measuring how an initial $1.00 investment would have grown if it earned the average private equity return of reporting state systems or the Public Stocks Benchmark return.
4 MSCI ACWI Index represents all global public equity markets. The MSCI ACWI ex US Index excludes the U.S. equity market. “ACWI” is an acronym for All Country World Index.
5 A recent example is contained in the otherwise excellent Bain Global Private Equity Report 2020, recently reported on by Pensions & Investments under the headline “U.S. Private, Public Equity Returns Starting to Converge.”
6 See, for example, Private Debt: Opportunities in Corporate Direct Lending, Stephen L. Nesbitt, John Wiley & Sons 2019, Chapter 9, for illiquidity premiums in private direct loans.
About the Author:
Steve Nesbitt is Chief Executive Officer and oversees all investment research as the firm’s Chief Investment Officer. Prior to forming Cliffwater in 2004, Steve was a Senior Managing Director at Wilshire Associates. From 1990 to 2004, Steve led the Consulting division at Wilshire Associates and also started and built its asset management business using a 'manager of managers' investment approach, including private equity and hedge fund-of-fund portfolios. Steve started his career at Wells Fargo Investment Advisors, an early pioneer in index funds, where he developed and managed index funds and oversaw asset allocation.

He graduated summa cum laude, with a BA in Mathematics and Economics from Eisenhower College (Rochester Institute of Technology), and an MBA, with Distinction, from The Wharton School at The University of Pennsylvania.
Stephen L. Nesbitt snesbitt@cliffwater.com
The views expressed herein are the views of Cliffwater LLC (“Cliffwater”) only through the date of this report and are subject to change based on market or other conditions. All information has been obtained from sources believed to be reliable, but its accuracy is not guaranteed. Cliffwater has not conducted an independent verification of the information. The information herein may include inaccuracies or typographical errors. Due to various factors, including the inherent possibility of human or mechanical error, the accuracy, completeness, timeliness and correct sequencing of such information and the results obtained from its use are not guaranteed by Cliffwater. No representation, warranty, or undertaking, express or implied, is given as to the accuracy or completeness of the information or opinions contained in this report. This report is not an advertisement, is being distributed for informational purposes only and should not be considered investment advice, nor shall it be construed as an offer or solicitation of an offer for the purchase or sale of any security. The information we provide does not take into account any investor’s particular investment objectives, strategies, tax status or investment horizon. Cliffwater shall not be responsible for investment decisions, damages, or other losses resulting from the use of the information. Past performance does not guarantee future performance. Future returns are not guaranteed, and a loss of principal may occur. Statements that are nonfactual in nature, including opinions, projections, and estimates, assume certain economic conditions and industry developments and constitute only current opinions that are subject to change without notice. Cliffwater is a service mark of Cliffwater LLC.