


By Stephen L. Nesbitt – Chief Executive Officer, Chief Investment Officer of Cliffwater.
This annual study tracks the investment performance of state pension plans over time. Its purpose is to provide feedback that potentially better informs investment policy. Of course, each state pension has its own set of unique circumstances but understanding the experiences and actions of state pensions collectively might prove valuable to decision-makers in executing their fiduciary responsibilities.
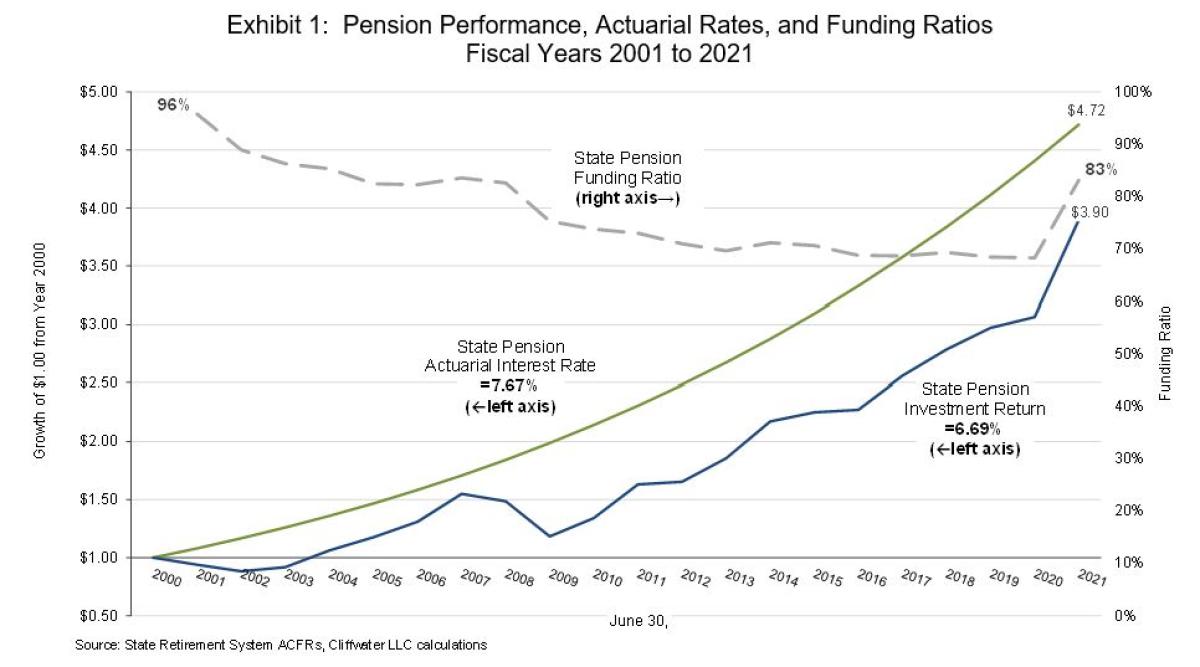
The three lines in Exhibit 1 capture the progression of state pensions for the 21 fiscal years beginning 2000 through 2021.1 The June 30, 2000 start date was selected because (1) state pensions were largely fully funded then, a byproduct of a long and strong bull market of the prior decade and (2) the period includes three significant bear markets and three bull markets, a seemingly fair representation of full market cycles. State pensions have collectively earned a 6.69% asset-weighted annual return over the 21-year period, trailing their 7.67% collective asset-weighted actuarial interest rate assumption. The 1.08% annual percentage point performance shortfall contributed greatly to a decline in pension funding ratios (assets divided by liabilities) from close to unity in 2000 to 83% (0.83) in 2021. The ratio of cumulative state pension investment return ($3.90) to cumulative actuarial interest return ($4.72) equals 0.83, equal to the 0.83 composite funded ratio provided in fiscal 2021 state pension financial reports. While other events undoubtedly have impacted pension funding, among them the failure of some states to make required contributions, outdated mortality tables, and unfunded benefit improvements, the failure of actuaries to properly underwrite long-term asset return is clearly the primary factor in pension underfunding today.
Looking forward, consultant 10-year return forecasts for diversified institutional pension portfolios average 5.38%[2], which is well below both the 6.69% actual state pension return over the past 21 years and below the current (fiscal 2021) 7.08% asset-weighted actuarial interest rate assumption. Achieving the 7.08% collective asset-weighted actuarial rate will be a challenge and a more likely outcome would be continued budgetary pressures as states find they must make up for shortfalls in asset performance through additional unscheduled pension contributions. This unfortunate circumstance does not factor in fiscal 2022 returns where early reporting suggests negative single-digit returns for most state retirement systems, likely causing a complete reversal of the funding gains in 2021.
Study Design and Data
We draw our findings entirely from data and descriptive narrative provided in the Annual Comprehensive Financial Reports (“ACFRs”) published by state pension systems unless otherwise noted. We select this data source because, unlike commonly used commercial universes, it is a closed group absent of selection biases, and represents results for large institutional investors.
Unfortunately, however, state pensions still are not consistent in their reporting of fees. Much of the performance measurement industry still reports returns before investment fees, and consequently, some fraction of returns presented in this report is before fees. This is especially true for public stock and bond asset classes, where approximately two-thirds of states report returns net-of-fees and one-third report gross-of-fees or make no mention of whether returns are net or gross. Our strong suspicion is that where the treatment of fees is not reported, returns are gross-of-fee.
An exception is alternative investments (private real assets, private real estate, private equity, and hedge funds) where returns are almost always reported net of fees. This is because either they are based on cash flows where fees are already netted, or in the case of hedge funds, performance is calculated on net asset value (“NAV”) from the fund administrator where fees are always deducted.
Because of the industry’s inconsistency in the netting of fees, our results should be viewed as a mix of net and gross returns where traditional asset classes generally, but not always, will be reported gross-of-fees and alternative asset classes almost always will be reported net-of-fees.
The study covers 65 state pensions that use June 30 as their fiscal year-end and report investment and other financial data as of that calendar date. Collectively, the 65 state pensions reported $3.3 trillion in assets on June 30, 2021. In those cases where multiple in-state pensions are managed under one investment board with a single investment strategy, performance for those multiple in-state pensions is counted once and not duplicated. There are 11 state pensions excluded that use December 31 as their fiscal year-end and another 5 state pensions that have fiscal year ends other than June 30 or December 31. While this report details findings only for the 65 fiscal June 30 state pensions, Cliffwater regularly conducts similar analyses on the other 16 state pensions with findings that are consistent with the study group presented here.
The report references two types of averages. When citing industry-wide statistics such as found in Exhibit 1 the “asset-weighted” average is used, which weights individual state pension values by state pension assets. The largest state pension in the data set is Calpers, with a 13% asset weighting over the 21-year time period. When citing statistics for individual asset classes an “average” value is sometimes presented which represents a simple average of individual state pension values.
21-Year Performance across State Pensions
Exhibit 2 plots 65 individual state pension cumulative returns together with the asset-weighted investment and actuarial averages from Exhibit 1.
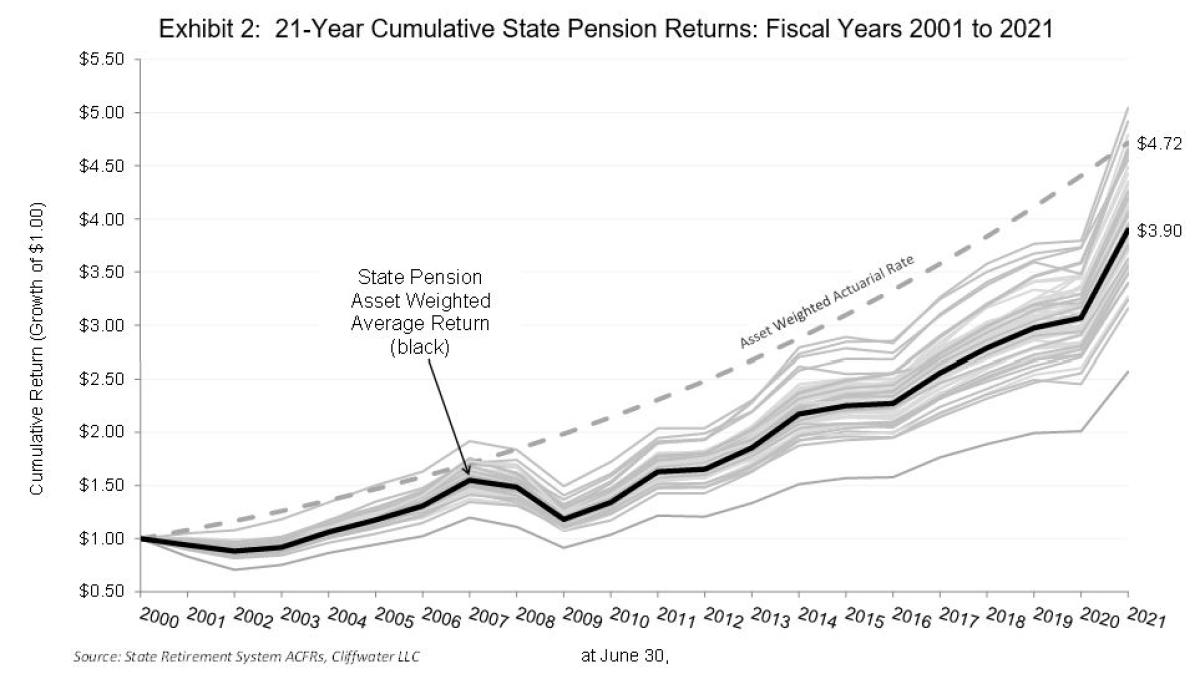
Exhibit 2 shows that none of the 65 individual state pensions exceeded the asset-weighted actuarial rate of growth. Our study also finds that only three individual state pensions achieved investment returns that exceeded their unique actuarial rate over the 21-year period. The average asset/actuarial return deficit was -1.02%, annualized, and the largest deficit was -3.55%.
Exhibit 2 also captures a meaningful dispersion in individual state pension returns over the 21-year study period, with percentile values given in Exhibit 3. Performance comparisons across state pensions is often discouraged by those involved. The argument is that each state pension expresses its own unique objectives and risk tolerance which is reflected in policy portfolios that are a byproduct of asset allocation studies. However, policy benchmarks measure only the implementation of policy and not the policy itself, which studies show have an outsized impact on return. This is also becoming important as asset allocation studies have migrated from standard models using standard asset classes to more complex risk-based models with non-standard asset classes. Performance comparisons across state pensions may be a useful way to assess the asset allocation and governance processes used by state pensions.
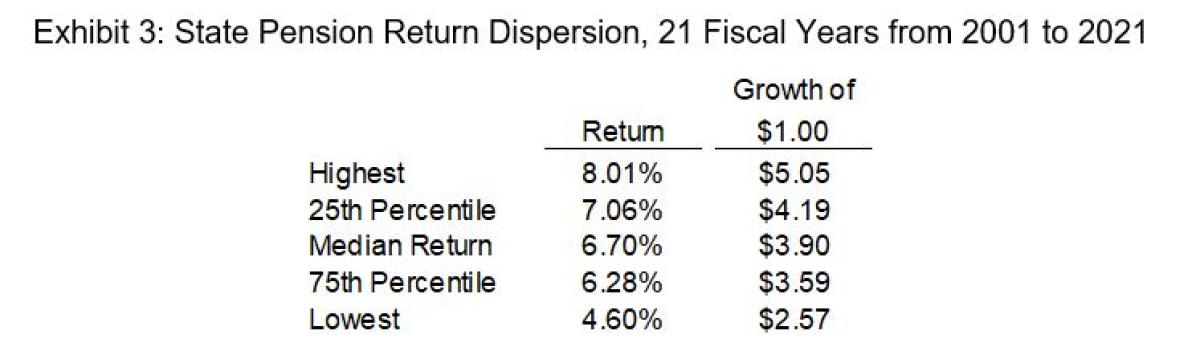
The 21-year returns for the 65 state pensions reflect the characteristics of a normal distribution. The difference between a first and third-quartile return equals a modest 78 basis points (7.06% minus 6.28%) but that difference compounded over 21 years produces a 60-percentage point difference in cumulative return (319% minus 259%). There are 6 state pensions whose 21-year returns differ from the 6.69% asset-weighted average return at a statistically significant level (t-statistic greater than 2.0 or less than -2.0). There are 3 states that outperform the group average at a level considered statistically significant and 3 states that underperformed at a statistically significant level. It is likely worth studying all 6 state pensions, a group of 3 to understand best practices, and a group of 3 for lessons learned.
Return and Risk
General stock and bond movements, measured by the MSCI ACWI and Bloomberg Aggregate Bond Indices, drive state pension performance for any individual fiscal year, as illustrated in Exhibit 4.
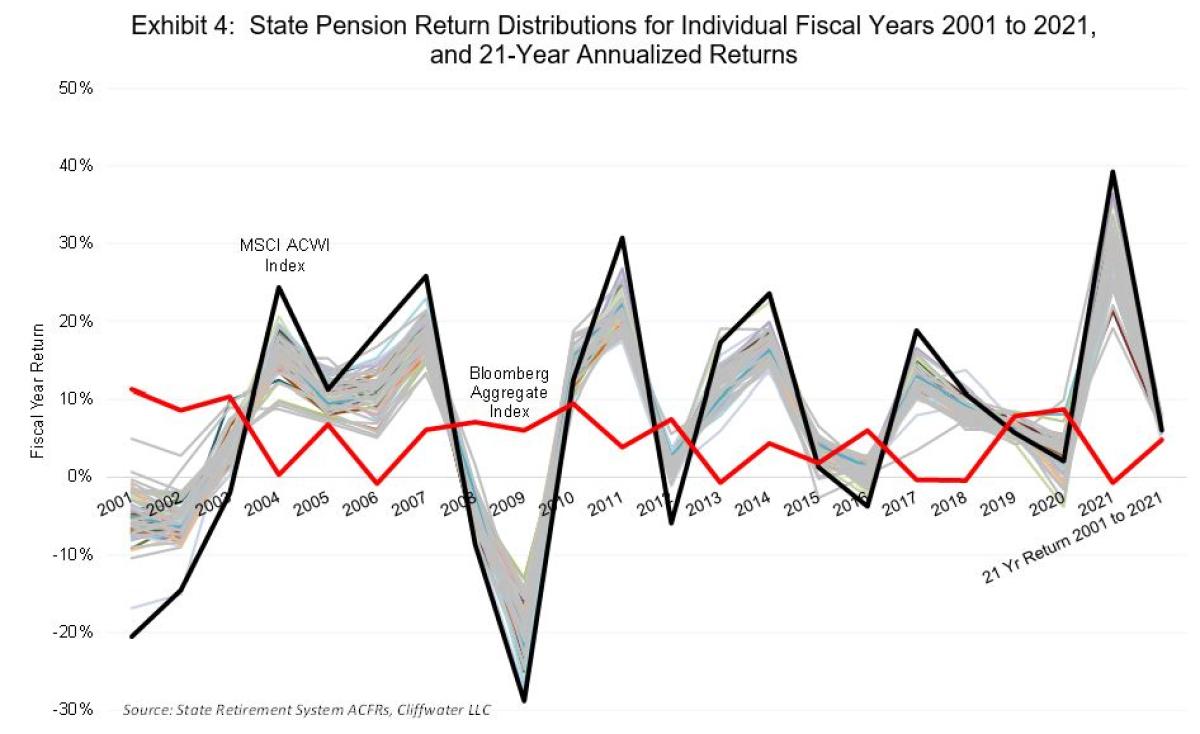
Exhibit 4 plots fiscal year-to-year returns for each of the 65 state pensions, ending with the 21-year annualized return. Each line represents one state pension system. Also shown are fiscal year returns for global stocks (MSCI ACWI Index) and U.S. bonds (Bloomberg US Aggregate Bond Index).
Cumulative, annualized 21-year returns are plotted at the far right in Exhibit 4. The ups and downs of individual years are offset to achieve longer-term returns more in line with expectations. Notice also that state pension returns for individual years appear well-bounded and largely explained by general stock and bond index returns. Year-by-year differences in state pension returns, caused largely by stock weightings, are compressed over time as demonstrated by the more compressed distribution of annualized returns for the 21-year time period.
Exhibit 4 illustrates the importance of stock price movements on individual fiscal year state pension returns and suggests that volatility in state pension assets is largely equity related. Our study finds a high but not unexpected 0.93 R-squared between individual state pension fiscal year returns and the MSCI ACWI Index. While global stock movements explain most of state pension asset volatility, the average state pension risk, measured by the standard deviation of fiscal year returns, equals 10.93% over the 21-year study period versus 19.35% for the MSCI ACWI Index. The average state pension equity beta equals 0.54. Together, these risk measures demonstrate that state pension return and risk are primarily driven by stock markets. Impressive also is the high correlation among individual state pension returns. The average state fund has a 0.97 R-squared with the asset-weighted state pension composite return, with the lowest value equaling 0.86. Collectively, these statistics suggest that the future health of all public pension systems is closely intertwined with the performance of the global stock markets.
10-Year and 21-Year State Pension Asset Class Performance
Exhibit 5 plots individual state pension returns and risk by major asset class. The returns cover the shorter 10-year period ending June 30, 2021, where a larger sample set of asset class returns is available compared to the 21-year sample set, particularly for private equity, real estate, and absolute return (aka hedge funds). Exhibit 6 provides statistics summarizing the asset class return data displayed in Exhibit 5.
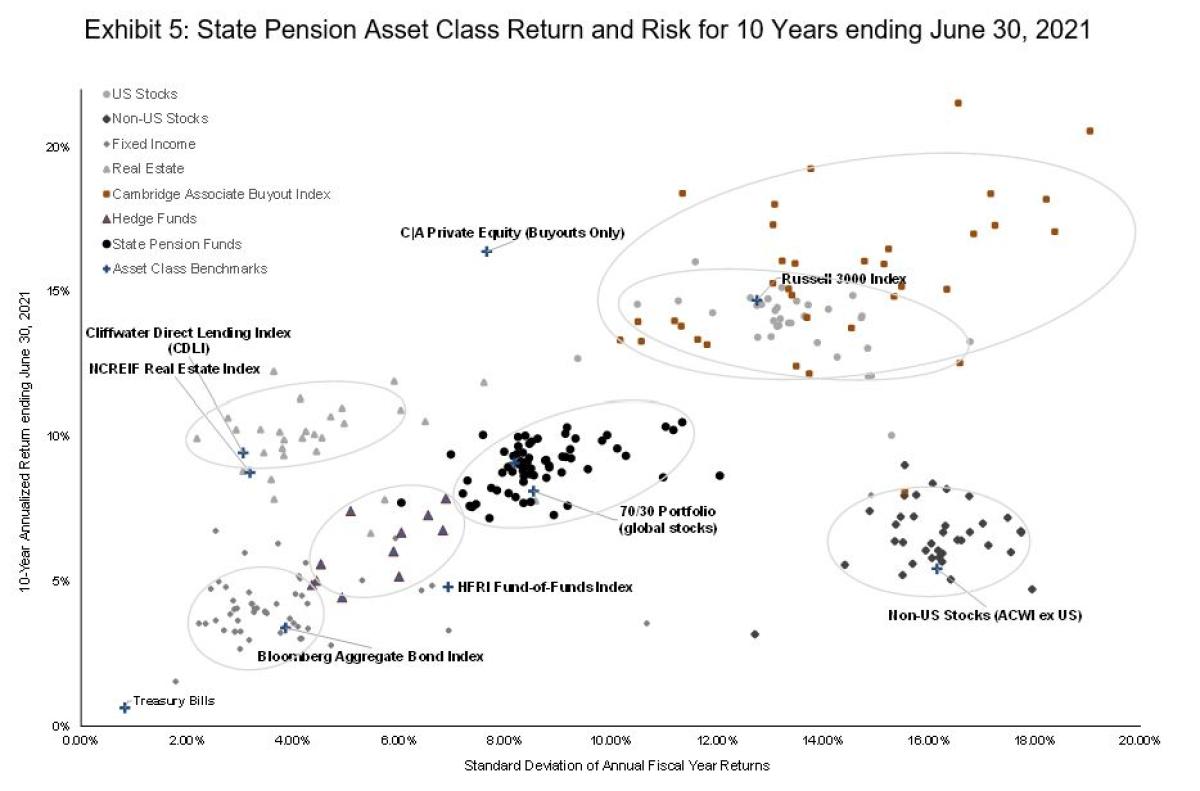
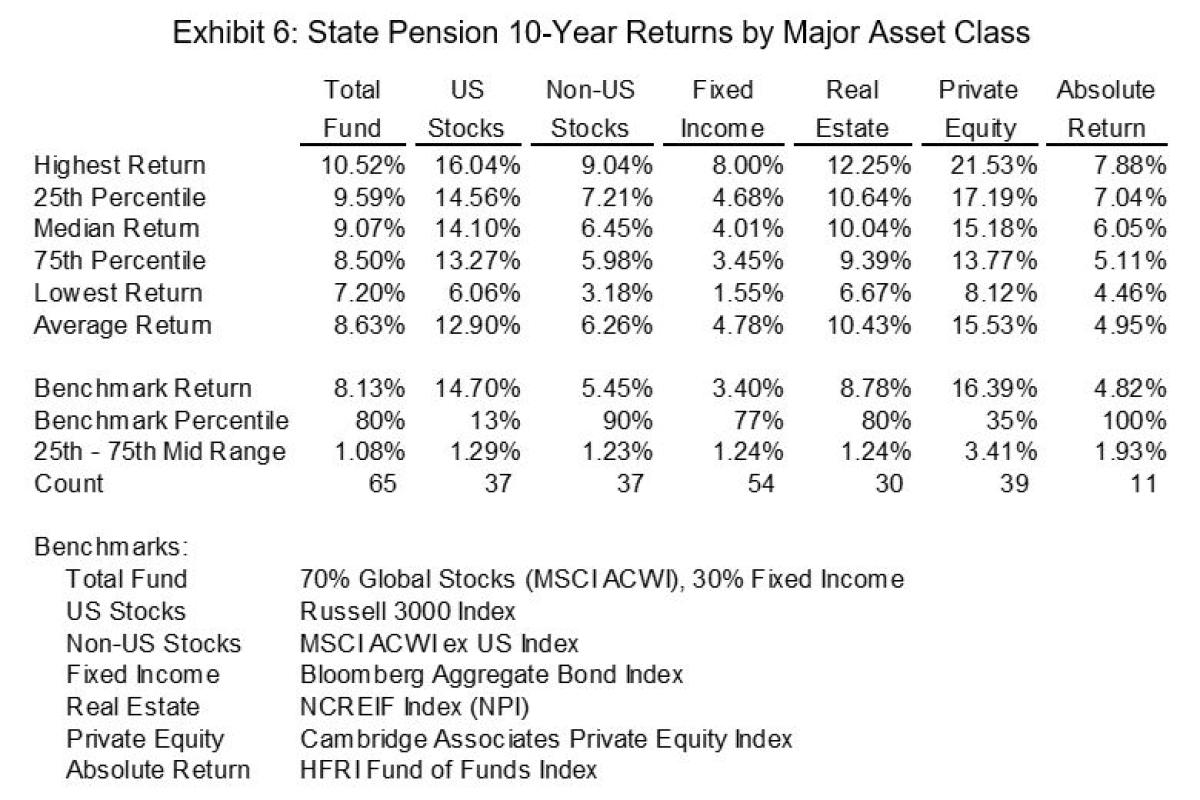
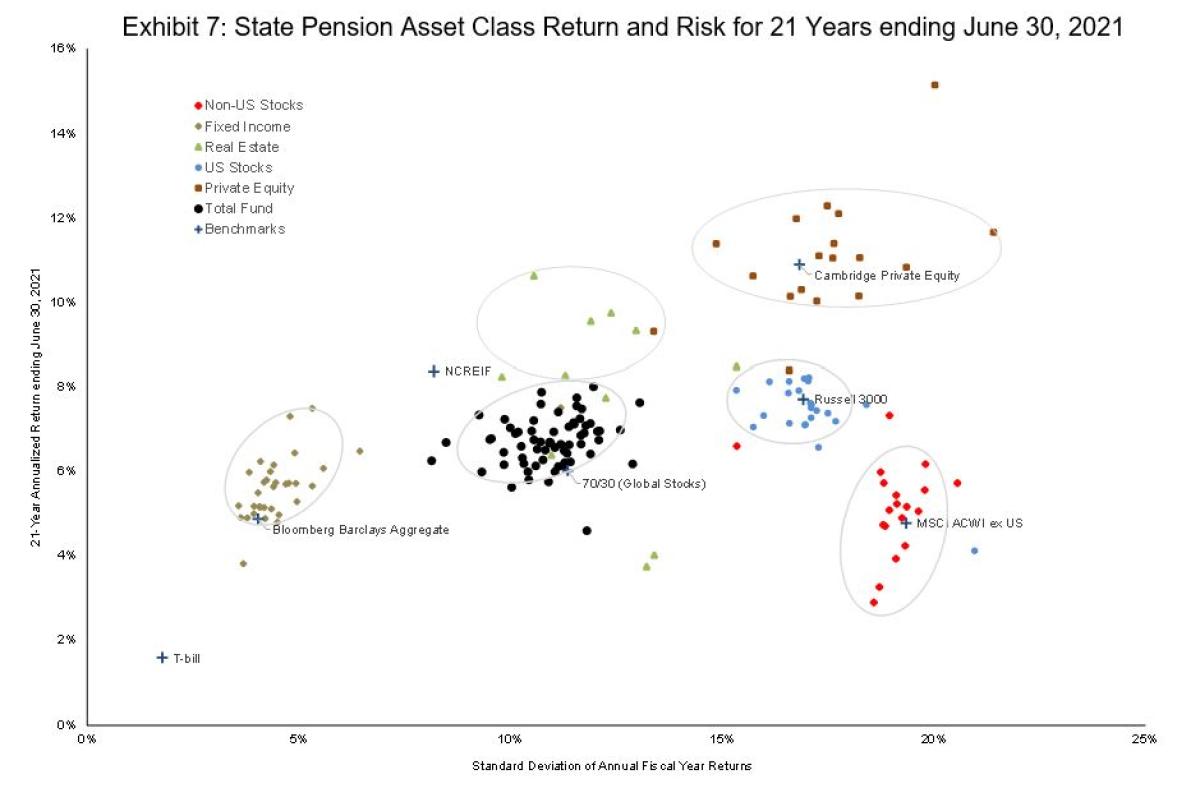
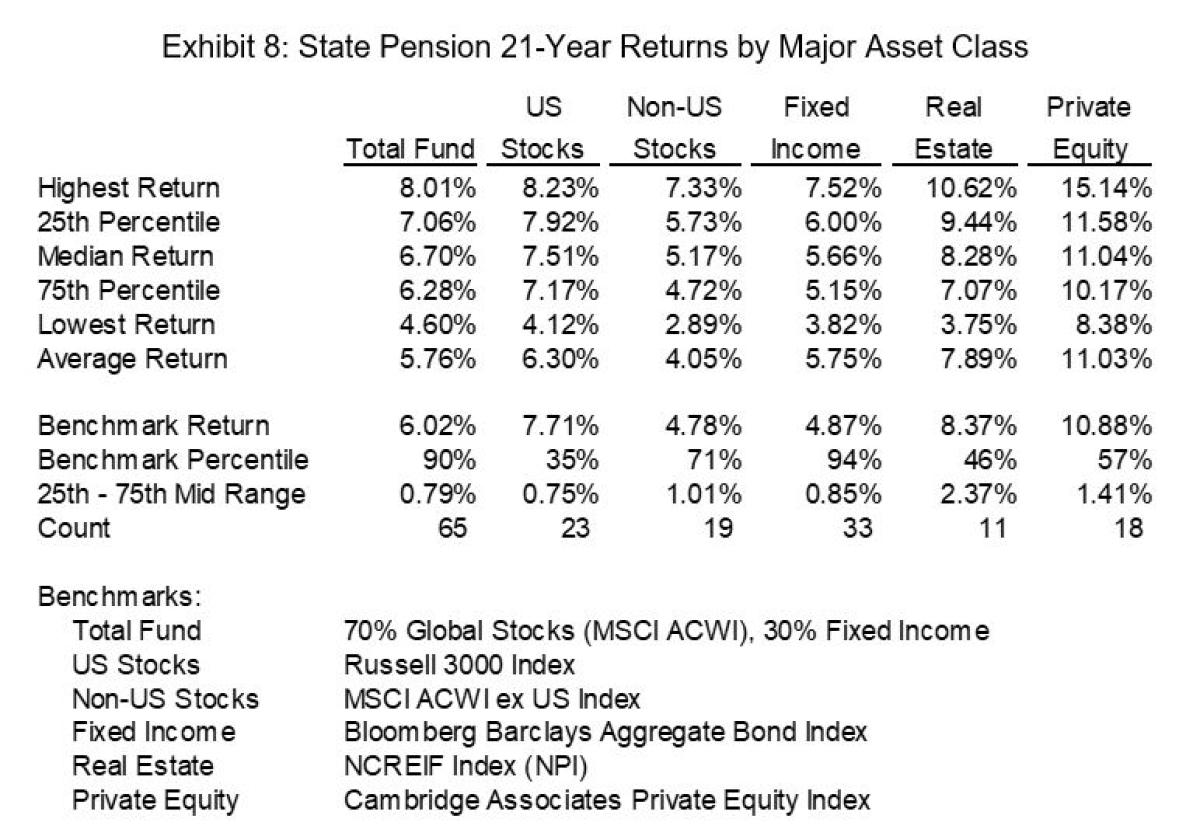
Exhibit 7 plots the longer 21-year return and risk for individual state pension asset classes with detailed return statistics provided in Exhibit 8. The 21-year sample set is smaller than the 10-year sample but large enough to draw some meaningful observations. Absolute Return (hedge fund) data is not shown as those asset class returns do not extend back to June 30, 2000.
Key performance takeaways from Exhibits 1-8 are:
- State Pension Historical Returns. The vast majority of state pensions failed to earn their actuarial interest assumptions over longer time periods. Their 6.69% asset-weighted annualized return over the last 21 years fell about one percentage point short of the 7.67% asset-weighted actuarial interest assumption for the same time periods. Because long-term pension returns are foremost determined by capital markets and not investment skill, the decline in funding ratio from 96% to 83% over the 21-year period is attributable to poor actuarial underwriting of future investment returns.
- State Pension Expected Returns. Shortfalls in state pension returns are most likely to continue. Horizon Actuarial Services finds a 5.38% expected long-term return for institutional portfolios from a survey of investment consultants. Cliffwater forecasts a comparatively higher 6.44% expected return for state pensions based upon allocations shown in Exhibit 10 and June 30, 2021 valuations, but still below the most recent 7.08% asset-weighted fiscal 2021 actuarial interest rate.
- State Pension Relative Returns. The 9.11% asset-weighted state pension return over the last 10 years fell within a wide 7.20% to 10.52% range for individual state returns, with the top-performing state pension outperforming the bottom-performing state pension by a cumulative 71% over 10 years, demonstrating the potential for significant financial consequences (positive and negative) underlying individual state investment policy and implementation decisions.
- We find no relationship between pension asset size and investment return over the 21-year and 10-year time periods with R-squared equal to -0% and 1%, respectively. The largest state pension system, Calpers, ranked in the bottom quartile of state pensions over both the 21-year and 10-year periods. The notion that fund size (scale) is an investment advantage has not been demonstrated across state pensions.
- We find no relationship between investment risk (standard deviation) and funding ratio with an R-squared of less than 1% for both 21-year and 10-year periods. Despite all the asset-liability rhetoric, the funding ratio doesn’t explain 21-year or 10-year state pension return or risk.
Active versus Passive. State pensions collectively benefited from not embracing a 100% passive strategy. Ninety percent (90%) of state pensions outperformed a passive 70%/30% mix of global
- stocks and US bonds over the 21-year time period and 80% of state pensions outperformed a passive 70%/30% mix of global stocks and US bonds over the shorter 10-year time period.
- Risk-Taking. State pension returns vary year to year, with an average annual standard deviation of return equal to 10.93%, measured over the last 21 fiscal years. Standard deviations for individual state pensions ranged from a low of 8.14% to a high of 13.06%, suggesting some meaningful differences in risk-taking among state pensions. By comparison, 21-year standard deviations for global equities and US bonds were 17.52% and 4.06%, respectively, with a 70%/30% portfolio annual standard deviation equal to 11.55%. However, contrary to expectations, differences in state pension returns appear only modestly correlated to standard deviation of return, with a 0.46 cross-sectional correlation between 10-year return and risk and a 0.20 cross-sectional correlation between 21-year return and risk. These statistics suggest that differences in state pension returns had more to do with differences in asset allocation implementation, rather than asset allocation policy.[3]
- US Equity. Most state pension US equity returns continue to lag the broad Russell 3000 Index return. The Russell 3000 Index ranks in the 35th and 13th percentiles against reported state pension US equity returns for 21-year and 10-year periods, an outcome which will likely continue the reallocation of US equity assets from active to passive management.
- Non-US Equity. Unlike US equities, most state pensions produced non-US equity returns that exceeded the MSCI ACWI ex-US Index, the most common non-US benchmark index. Covering the 21-year and 10-year time periods, 71% and 90%, respectively, of state pensions exceeded index returns.
- Fixed Income. State pension fixed income returns successfully outperform the Bloomberg US Aggregate Bond Index return, returning 5.15% and 3.45% over the last 21-year and 10-year periods, respectively, compared to index returns of 4.87% and 3.40%, respectively. State pensions generally achieve these above index returns by taking more credit exposure compared to the Index through allocations to non-investment grade bonds and bank loans. For example, the Bloomberg High Yield Bond Index returned 7.93% and 6.66%, for the same 21-year and 10-year periods, respectively. State pensions that overweight credit within their traditional fixed-income portfolios have been rewarded over time, but during market downturns, such as fiscal 2009, the average state pension bond return underperformed the Bloomberg Aggregate Bond Index by 3.81%.
- Private Equity.[4] Private equity continues its history of providing state pensions the highest asset class returns, with average returns equal to 11.03% and 15.53%, respectively, over the 21-year and 10-year study periods. These returns outperform public market equivalent (PME) returns by 4.10% and 3.67%, respectively, over the 21-year and 10-year study periods. PME returns reflect a 70% weighting to the US stocks (Russell 3000 Index) and 30% weighting to non-US stocks (MSCI ACWI ex US), weights reflecting Cliffwater qualitative and quantitative assessment of private equity geographic allocations.[5] Finally, private equity returns vary widely across state pensions suggesting that implementation is a critical factor in individual state private equity return outcomes.
- equaled 8.05% and 9.67%, respectively, over the 21-year and 10-year periods, levels about equal to the 8.37% and 8.78% returns for the NCREIF Index of private real estate over the same time periods. Some state pensions include publicly-traded REITs as part of what is an asset class largely comprised of private real estate investments. The presence of public REITs, if held consistently, should have helped performance for the 21-year and 10-year time periods because the NAREIT Index of equity REITs returned 10.67% and 9.41%, respectively, for those periods.
- Absolute Return. Hedge fund returns exceeded benchmark HFRI Fund-of-Funds Index returns but their absolute level, averaging 6.05% over the last 10-year period, fell well short of investor expectations. Returns extending back 21 years are not available for this asset class.
- Real Assets, Private Debt, and Risk Parity. Return histories among state pensions for other alternative assets consist of only a few years in most instances. Looking just at the last four fiscal years (2018-2021), real assets, private debt, and risk parity earned average returns equal to 7.19% (33), 7.44% (18), and 8.02% (7), respectively, below the asset-weighted average 11.10% (65) total state pension return for the three 2018-2021 fiscal years. The number of state pensions reporting returns is in parentheses.
State Penson Asset Allocation
State pension boards and staffs are fully aware of the investment challenges ahead and began some time ago to gradually shift their asset allocation strategies to include the use of alternative investments. These alternative investments consist primarily of allocations to private equity, private real estate, hedge funds (aka absolute return), private debt, and private real assets. Exhibit 9 shows the historical growth in state pension allocations to alternative investments for the time period 2006 to 2021.
Allocations to alternatives increased dramatically soon after the 2008 Financial Crisis, rising from 10% of total assets in 2006 to 21% in 2011, and thereafter steadily increased to 33% of total assets on June 30, 2021. Most of the increase in alternatives has come from public equities, which fell from 61% in 2006 to 46% in 2020. However, in 2021 the increase came from a decrease in fixed income.
The shift to alternatives over the past decade is a byproduct of lower expected returns from traditional asset classes, especially fixed income, and the desire to avoid potential sharp drawdowns that can come from public equities. Alternatives are perceived as potentially meeting these dual objectives of return and lower volatility. The tradeoff is less liquidity, investment complexity, and higher fees compared to traditional asset classes.
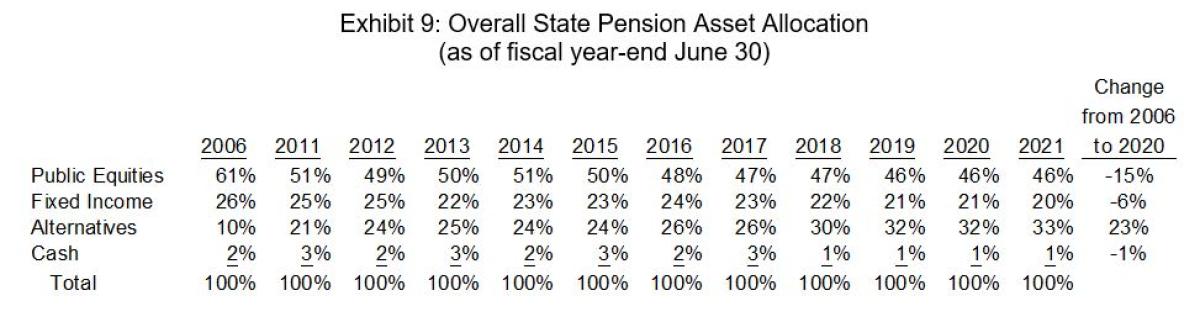
Exhibit 10 provides a detailed breakdown of the types of alternative investments that comprise the 33% allocation by state pensions.
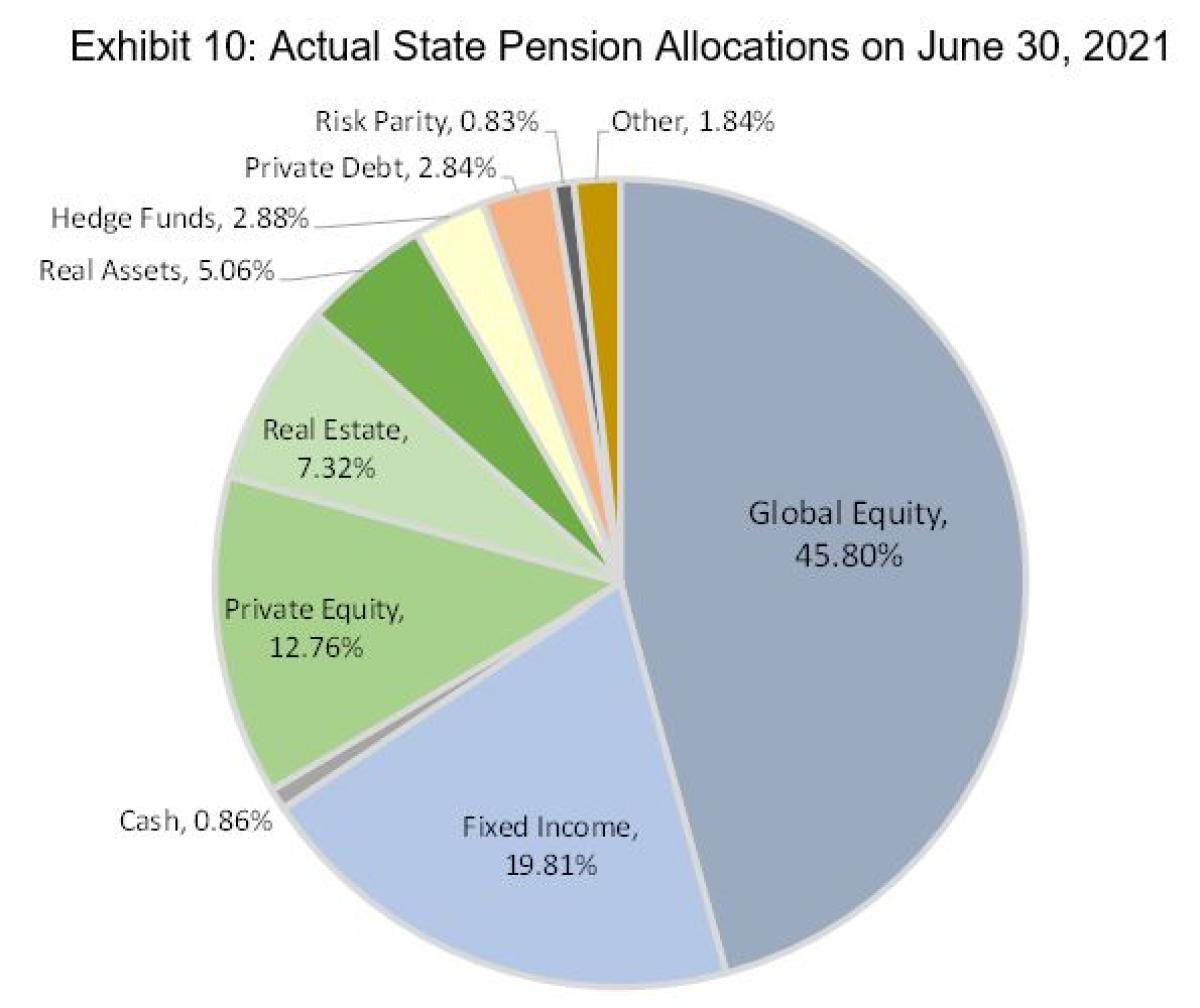
All categories of alternative investments have grown since 2006 when they equaled 10% of total assets. Private equity allocations have more than doubled, from 4.1% in 2006 to 12.8%, an 8.7% increase. Real estate grew more modestly, from 4.4% in 2006 to 7.3% in 2021, a 3.3% increase. The remaining 13% additional allocation to alternatives, outside private equity and real estate, has been directed to alternatives that had little or no representation in state pensions in 2006.
The largest single beneficiary of increased alternative allocations is real assets, which includes a range of sub-strategies such as commodities, energy & mining, infrastructure, and agriculture. Infrastructure and energy represent the largest sub-strategies within real assets. Real assets are expected to provide a high single-digit return that is positively correlated with unexpected inflation. Their 5.1% June 30, 2021 allocation is further described in Exhibit 11, which shows for each alternative investment not only their percentage of total state assets, repeated from Exhibit 10, but also allocations for only those state pensions making allocations, and the highest allocation among the state pensions. For example, real assets represent 5.1% of total state pension assets, a higher 7.6% of state pension assets when only state pensions with real asset allocations are counted, and a 16.5% allocation for the state with the greatest percentage allocation to real assets.
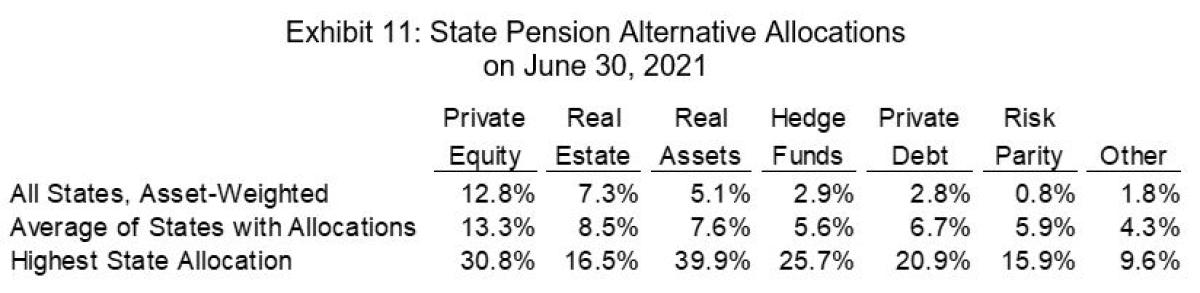
Hedge funds grew from 0.3% in 2006 to 2.8% on June 30, 2021, but most of the growth occurred immediately after 2008, and allocations have remained roughly unchanged or shrunk over the past several years. Still, of those states investing in hedge funds, their average allocation equals 6.7% and a few states allocate much higher amounts.
Private debt is the newest and fastest-growing alternative investment, representing 2.8% of total state pension assets, and averaging 6.7% of total assets among state pensions with dedicated allocations. Actual allocations to private debt are higher, as most assets within the “Other” category represent opportunistic credit investments. The interest in private debt stems from the desire for high and immediate cash flow with low volatility, potentially filling the void in the northwest corner of Exhibits 5 and 7 above.
Risk parity is an allocation strategy that can combine both traditional asset classes and alternatives, and where asset classes contribute equally to total portfolio risk. Risk Parity portfolios become optimal mean-variance portfolios when leverage is unrestricted and asset classes have identical Sharpe Ratios[6], allowing correlations to drive optimal asset weights. Allocations to risk parity remain small at 0.8% of total assets and largely unchanged in recent years.[7]
Finally, many state pensions designate an “Other”, “Opportunistic”, or “Innovation” asset class that is dedicated to investment strategies that can’t be classified as part of their traditional or designated alternative investments. These other alternatives have been income in nature with the intent to achieve high cash flow but low correlation to equities. Re-insurance, life settlements, and credit opportunities are examples.
Conclusion
The purpose of our annual state pension study has been to aid in the understanding of the asset performance achieved by state pensions. State pensions overall have been successful stewards of assets over our 21-year study period, achieving returns that captured the opportunities presented by global markets, and then some.
However, we find significant differences among individual state pension 21-year and 10-year returns, mostly unexplained by simple differences in asset allocation or risk-taking. Some state pensions just appear more effective in implementing asset allocation compared to others.
We recommend that fiduciaries overseeing state pensions continue to allocate resources towards maximizing the return potential from its asset classes, paying attention to differences in how state pensions implement within asset classes.
Footnotes:
[2] “Survey of Capital Market Assumptions: 2021 Edition”, Horizon Actuarial Services, LLC.
[3] Allocators worry that risk calculations for private equity and real estate are understated due to a potential for “smoothing” of returns in the valuation process. The presence of smoothing can be discovered by measuring serial correlation among returns. We find little evidence of smoothing in private equity returns. The serial correlation of private equity returns over the longer 21-year period measures 0.36, roughly equal to the 0.27 serial correlation found in the Russell 3000 Index. The average serial correlation for state pension real estate returns equals a higher 0.41, suggesting slightly higher risk levels than those calculated.
[4] See “Cliffwater Research – Long Term Private Equity Performance, 2000-2021” for a more detailed analysis of private equity performance.
[5] A regression using the average state pension private equity return as the dependent variable and the S&P 500 and the MSCI ACWI ex US indices as independent variables finds a “best-fit” weighting of 75% S&P 500 and 25% MSCI ACWI ex US. Our selection of 70% S&P 500 and 30% MSCI ACWI ex US reflects our preference for an approach that relies on fundamental analysis of company holdings in determining PME index weights.
[6] Sharpe Ratio equals excess return, defined as total return minus risk-free rate, divided by risk.
[7] See Cliffwater Research, “Risk Parity” (January 2018) for a detailed description.
About the Author:
Steve Nesbitt is the Chief Executive Officer and Chief Investment Officer of Cliffwater, and is primarily responsible for the day-to-day management of Cliffwater Corporate Lending Fund (CCLFX) and the Cliffwater Enhanced Lending Fund (CELFX), an SEC registered credit interval fund focused on the US corporate middle market.

Steve is recognized for a broad range of investment research. His papers have appeared in the Financial Analysts Journal, The Journal of Portfolio Management, The Journal of Applied Corporate Finance, and The Journal of Alternative Investments. His private debt research led to the creation of the Cliffwater BDC Index, measuring historical BDC performance, and the Cliffwater Direct Lending Index, measuring historical performance for direct middle market loans. Steve authored the book, Private Debt: Opportunities in Corporate Direct Lending, Wiley Finance (2019) which provides the analytical and empirical underpinnings of the private debt market.
Stephen L. Nesbitt snesbitt@cliffwater.com
The views expressed herein are the views of Cliffwater LLC (“Cliffwater”) only through the date of this report and are subject to change based on market or other conditions. All information has been obtained from sources believed to be reliable, but its accuracy is not guaranteed. Cliffwater has not conducted an independent verification of the information. The information herein may include inaccuracies or typographical errors. Due to various factors, including the inherent possibility of human or mechanical error, the accuracy, completeness, timeliness and correct sequencing of such information and the results obtained from its use are not guaranteed by Cliffwater. No representation, warranty, or undertaking, express or implied, is given as to the accuracy or completeness of the information or opinions contained in this report. This report is not an advertisement, is being distributed for informational purposes only and should not be considered investment advice, nor shall it be construed as an offer or solicitation of an offer for the purchase or sale of any security. The information we provide does not take into account any investor’s particular investment objectives, strategies, tax status or investment horizon. Cliffwater shall not be responsible for investment decisions, damages, or other losses resulting from the use of the information. Past performance does not guarantee future performance. Future returns are not guaranteed, and a loss of principal may occur. Statements that are nonfactual in nature, including opinions, projections, and estimates, assume certain economic conditions and industry developments and constitute only current opinions that are subject to change without notice. Cliffwater is a service mark of Cliffwater LLC.