


By Christoph Junge, Head of Alternative Investments at Velliv; Denmark’s third-largest commercial pension company.
After a very eventful year 2022 I was thinking of changing the pace of this column from quarterly to semi-annually. Alternatives are long-term investments after all. But the first quarter of 2023 was fairly dramatic again with three small- to mid-size US banks failing over the course of five days, followed by the forced merger of UBS and Credit Suisse after the latter experienced a dramatic loss of deposits. So, for now I keep it quarterly and hope for more calm markets going forward.
Listed assets, in this column S&P 500 and global government bonds, posted both positive returns after a disastrous 2022. A widely used benchmark for a balanced portfolio consisting of 60 pct. equities and 40 pct. bonds gained 5,7% after losing 17,9 % over the course of the last year.
Alternatives performance showed huge dispersion last year, with real assets and CTA delivering much-needed positive returns and especially Venture Capital getting hammered. It seems dispersion on both asset classes but also manager level is still the name of the game, even in 2023. Some alternative asset classes posted record-breaking returns in Q1 while others posted record-breaking losses. And the divergence between listed and unlisted markets is still heavily debated and something that I am looking further into in this column.
But before we dig into the numbers, I want to remind you of a few technical facts of importance.
- Most alternative investments, aside from liquid alternatives, are long-term investments. To evaluate the performance over a single quarter has limited explanatory power.
- There is always a time lag between reported returns and public market returns due to the illiquid nature of the underlying investments.
- The benchmarks chosen for Private Equity and Venture Capital are liquid replication benchmarks. Over longer timeframes, they have historically given a somewhat reliable picture of the asset classes but over a shorter horizon, they typically overstate the movements in the market (both up and down), according to my own analysis.
- Alternative investments are very heterogenous in their nature with huge dispersion also on the manager level. The realized returns of an investor will most likely deviate from the benchmark-level returns.
Table 1 – Performance of various alternative and traditional asset classes
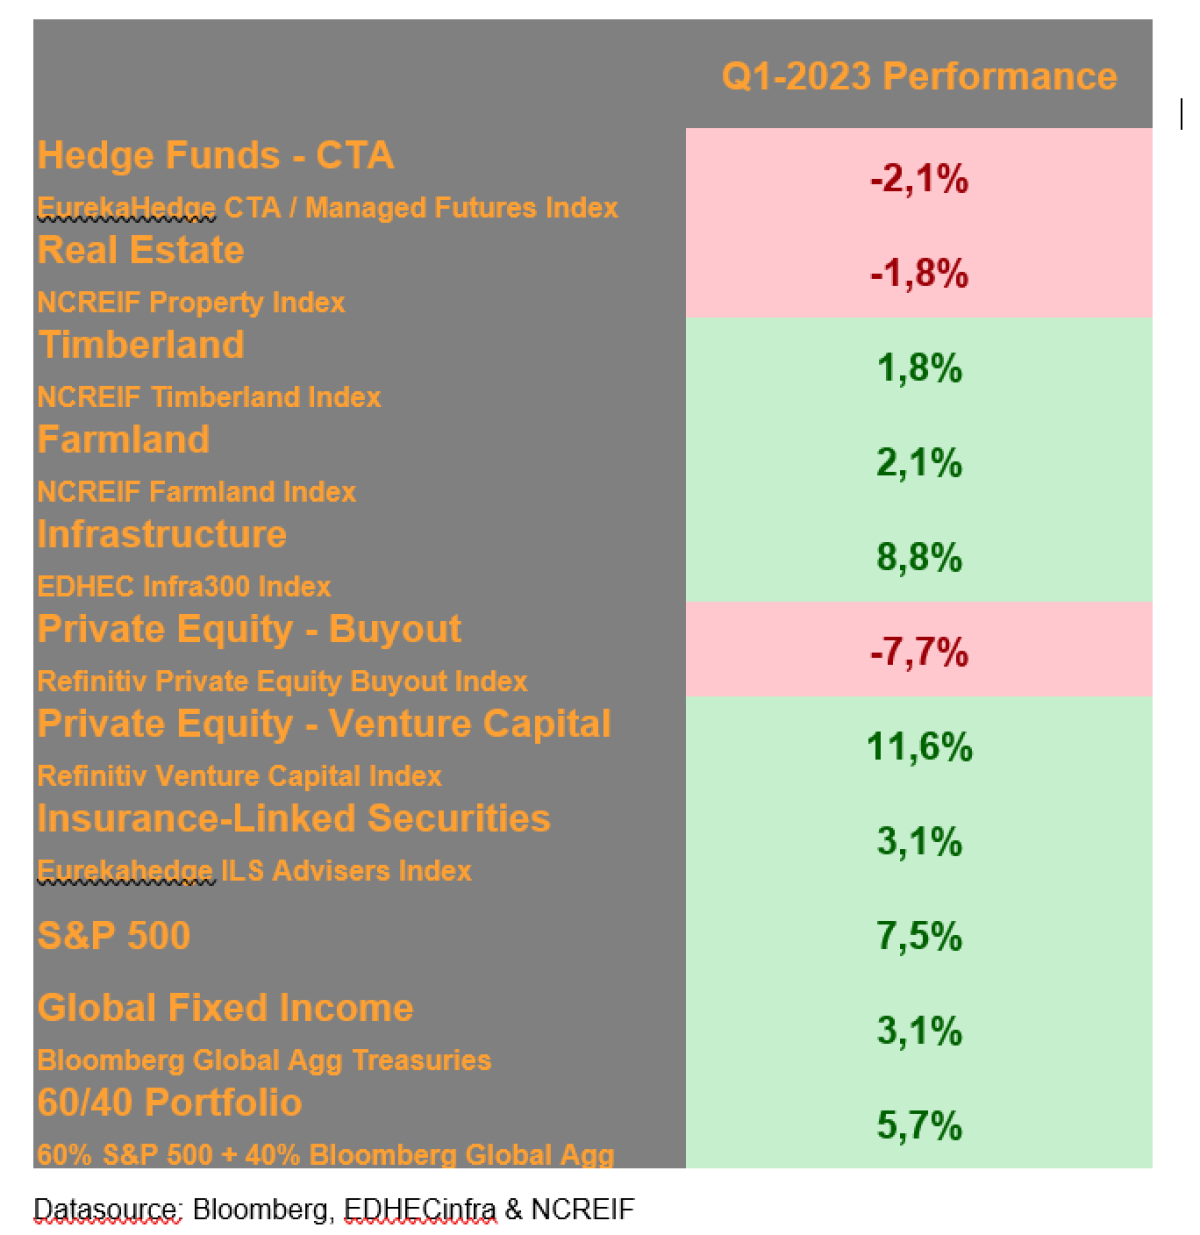
CTA, a sub-asset class from the hedge fund universe that is known for using trend following models, had a bad first quarter with several major trends reversing. Particularly the collapse of interest rates during March in the aftermath of the banking crisis was a costly affair when the US 2YR Treasury rate dropped by a whopping 109 bps. over the course of three days. This resulted in the worst two-day performance for the SG CTA Index since its inception 23 year ago, a drawdown of -7,45%.
Worst two-day performance for the SG CTA Index since inception
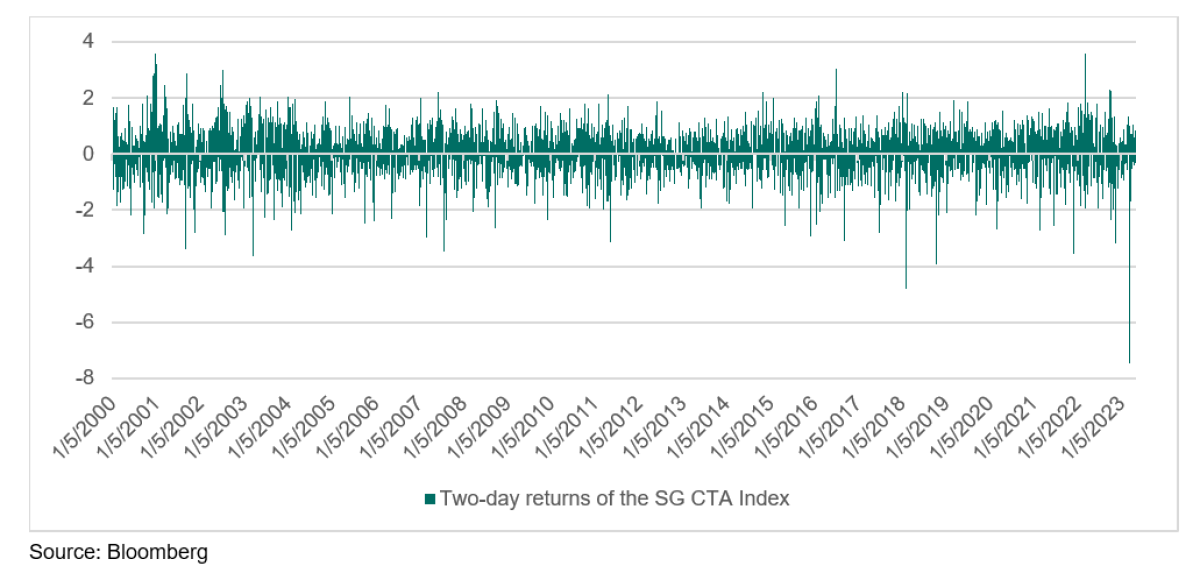
The SG CTA Index closed the quarter down by -4,4% and the EurekaHedge CTA / Managed Futures Index down by -2,1%.
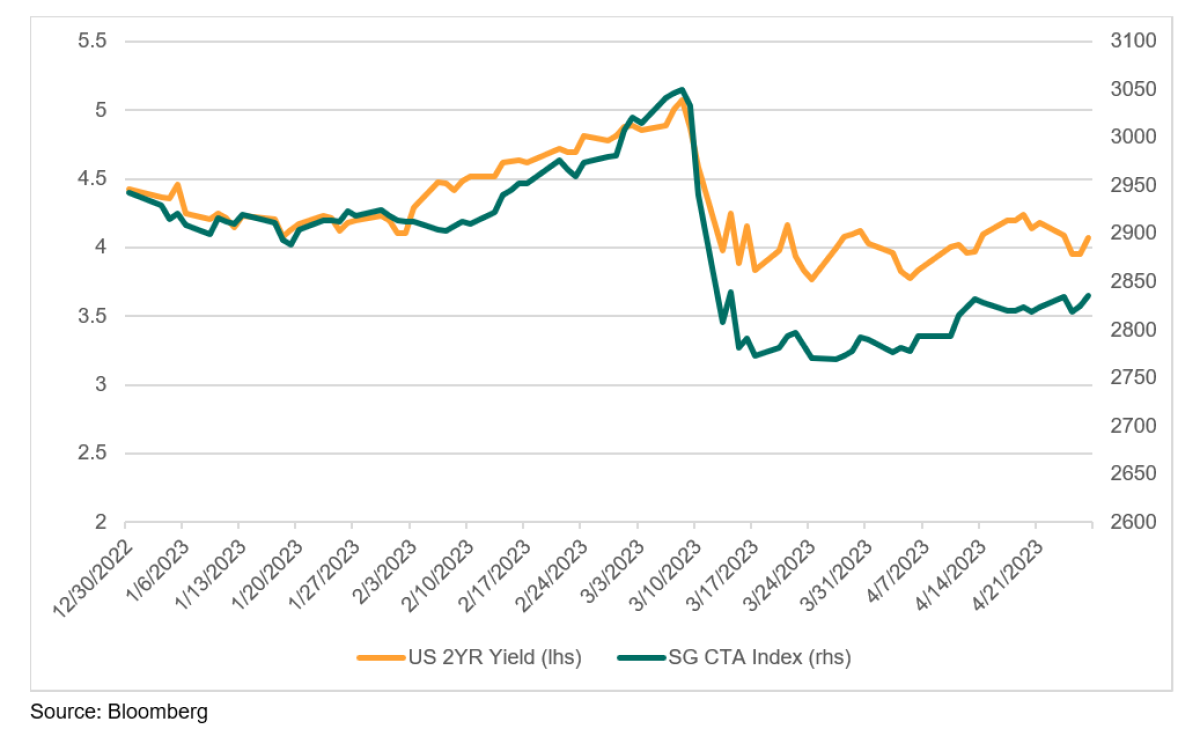
That fixed income was a major return driver can be seen in the chart below, where the SG CTA Index is closely following the 2YR US Treasury yield.
SG CTA Index and 2 year US Treasury yields were moving together in 2023
Real Estate, as represented by the NCREIF Property Index, an unlevered index of directly held properties in the US, slowed further down and ended the quarter with a loss of 1,8%. Office continued its losing streak and posted another loss of 4,1%. The office segment has thereby a negative total return over the last three years. Sales of global office properties also fell to the lowest level for more than a decade in Q1 2023, according to MSCI Real Assets. Industrial and apartment were down as well. Hotels, on the other hand, continued its winning streak with another positive quarter, being up by 2,3%. Retail was the second positive sector with positive returns, posting a gain of 0,5%. Both sectors were hit hard by the Covid crisis and are now recovering from low levels.
According to research from MSCI, the UK real estate market correction from the peak in Q2 2022 was way faster than during the 2008 global financial crisis and late-1980s recession. But it might also be of much shorter duration as March 2023 was the first month with positive total returns for the MSCI UK Monthly Property Index since June 2022. Remains to be seen, whether this was a single swallow or more sustained.
Both timberland and farmland started the year with positive returns of 1,8% and 2,1% respectively. The farmland returns were mostly driven by annual cropland returns (also known as row crop like wheat and corn) posting a strong 3,3%, while permanent cropland like almond plantations were only up by 0,17%.
Infrastructure, as represented by the EDHEC Infra300 Index, continued with very strong returns in Q1 after ending the last year with a bang. The index was up 8,81% in the 1st quarter, which was mainly driven by a lower equity risk premium. High demand for unlisted infrastructure continues to support asset values, according to EDHECinfra.
From a business model perspective, all types had a strong quarter, but it was again the contracted assets that were major contributors, standing for app. half of the returns followed by regulated and merchant assets. Especially the transportation sector but also renewable power and network utilities had another good quarter.
Private Equity had a mixed start to the year with Buyouts down and Venture Capital up. This holds true at least the liquid replication benchmarks used in this column. This comes after a disastrous year 2022 for especially Venture Capital. On the other hand, the positive performance for VC is in contrast to this report from Pitchbook on “real” Venture Capital, that states that US Venture Capital valuations continued their descent in Q1 2023.
This once again highlights the divergence between listed markets and private markets and brings me back to the question “are private equity valuations correct”?
Well, according to this article from Stepstone Group, at least Buyout valuations are about right. The authors back this statement with a lot of data showing among other things that valuations compared to S&P 500 are not wildly overvalued, even though a bit higher than historically. With that being said, the true valuation gap was in 2020 when listed valuations were excessive, as also highlighted in my previous columns. In addition to that, they show that revenue in private equity owned companies grew on average 4,1% more each year than the revenue in S&P 500 companies – and much more in the post-GFC time – arguing that the rising valuations are driven by rising revenue. And finally, they show that valuations prior to exit tend to reflect the exit value (or might even exit at a premium to carrying value).
This analysis from Hamilton Lane comes to the same conclusion with regards to valuations. And even more importantly, Hamilton Lane shows that the outperformance of Private Equity compared to public equities comes from better operational performance. As they state: “Nearly 40% of companies in the Russell 2000 index have negative earnings. Not earnings growth, just negative earnings. Only 8% of private companies had negative EBITDA through Q3 2022.”
Could it be that something has structurally changed?
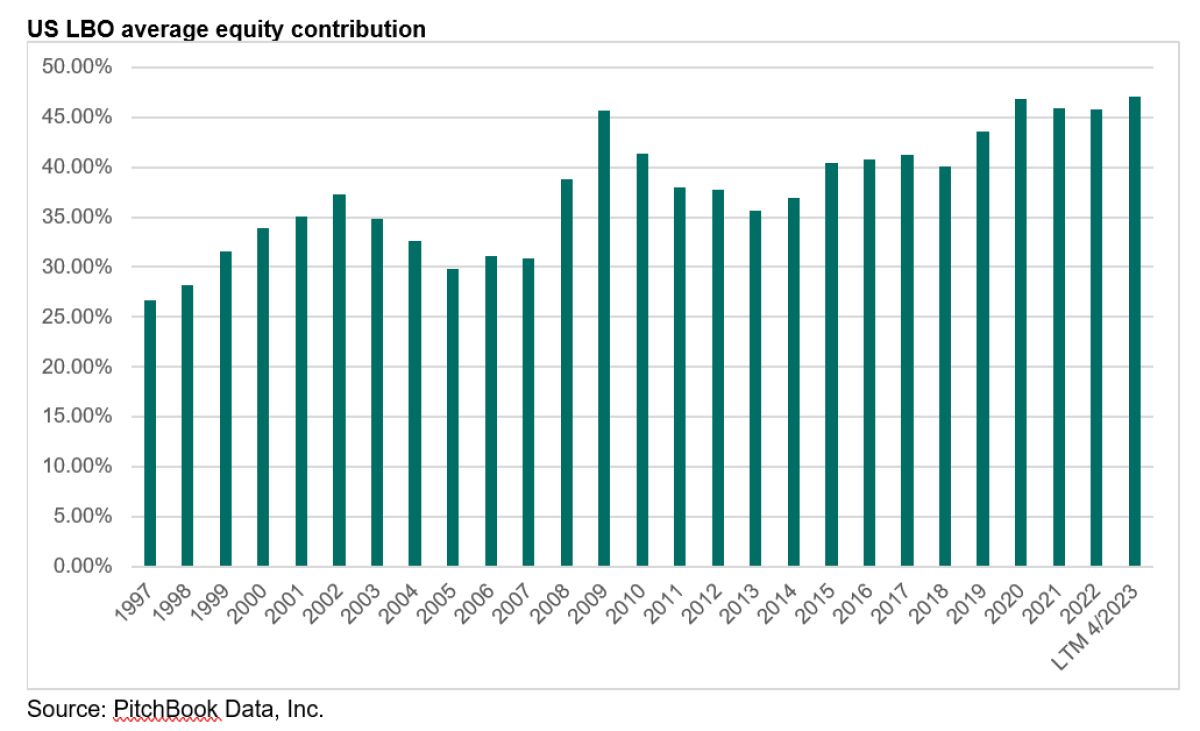
One of the changes is the role of debt. As shown in the chart below, the average equity contribution is US buyouts in 1997 was only 26,7% (and debt 73,3%). This has increased to 47% during the last 12 months.
Another fundamental change was documented in this whitepaper from Partners Group, where they show, that Buyout and public markets reversed roles. The typical IPO candidates in the 1980’s were well-developed, profitable businesses while private equity investments typically were more opportunistic in nature. According to the authors, the role reversal of public and private markets began in the late 1990s and accelerated in the 2000s. Today, the share of IPO’ed businesses with positive earnings has fallen to 21%, down from 85% in 1990. Private markets (buyout) on the other hand finance growth of profitable businesses from the real (old) economy.
Albeit a cocktail consisting of higher interest rates, high inflation and tougher borrowing led to a quarter-over-quarter decline in global deal activity, there was still a good amount of activity with 10.625 M&A deals closed in Q1 2023, according to Pitchbook. This is approximately in line with deal activity prior to the pandemic.
Overall, it is fair to say that Private Equity activity is cooling down, but not falling off a cliff.
It will be interesting to see, whether the discussed fundamental changes will manifest itself in further divergence between public and private markets going forward. Maybe the old saying that PE is just levered small cap is no longer true. Private Equity managers have become much more operational experts to drive returns and rely much less on financial engineering. But I have the feeling that the debate is not settled yet.
Insurance-Linked Securities (ILS), often also referred to as “CAT Bonds” (catastrophe bonds), had a strong first quarter with positive returns of 3,1% for the EurekaHedge ILS Advisors Index and 5,0% for the Swiss Re Global CAT Bonds Index. According to Artemis, an internet platform dedicated to the ILS industry, this was the second strongest start to a year on-record for the EurekaHedge ILS Advisors Index, reflecting the strong ILS.
and catastrophe bond pricing seen in recent months, as well as the elevated return from the risk-free rate on collateral as well.
Conclusion: What a year so far! Failing banks, CTA posting the worst two-day performance for the SG CTA Index since its inception 23 year ago after a record breaking 2022, huge dispersion in Private Equity across both sub asset classes and managers and ILS having the second best first quarter in the history of the benchmark. Infrastructure, timberland, and farmland are so far having a good year as well and manifest their role as an inflation hedge.
Real estate is feeling the heat from the strong rise in interest rate that eventually led to rising cap rates (there is no linear relationship between interest rates and cap rates). Especially the office segment is suffering at present not only from rising rates but also more structural challenges. An increase in vacancy in connection with a potential downturn would certainly not be positive.
Will inflation eventually be tamed, and interest rates come down? And will we end up in a recession? These questions will most likely define the performance of many alternative asset classes through the course of the year.
About the Author:
Christoph Junge is Head of Alternative Investments at Velliv; Denmark’s third-largest commercial pension company. He is a Chartered Alternative Investment Analyst and has more than 20 years of experience from the financial industry in both Denmark and Germany. He has worked with Asset Allocation, Manager Selection as well as investment advice in, among others, Nordea, Tryg and Jyske Bank.
Besides working as a Head of Alternatives, Christoph teaches a top-rated course on Alternative Investments. Read more at http://www.christoph-junge.de
