


By Perry Li, CFA, FRM, Senior Investment Strategist at Parametric.
We investigate the phenomenon of the flattening skew and how volatility impacts the value of the Cboe VIX index. Learn what options-based strategies are attractive during this time of uncertainty.
Is the Cboe Volatility Index (VIX) low or high? And which options-based strategies are more attractive when the volatility skew is flat?
We saw volatility and sizable drawdowns in many investment classes in 2022, in contrast to the 70 all-time highs the S&P 500® Index made in 2021. We ended with 2022 being the sixth most volatile year since World War II. Despite a year full of geopolitical and macroeconomic events, investors may have found the VIX less exciting this year than in 2020. The daily closing value of the index was entirely in the range of 16 to 37, versus the 83 high in 2020.
Did VIX accurately forecast and respond to the higher realized volatility?
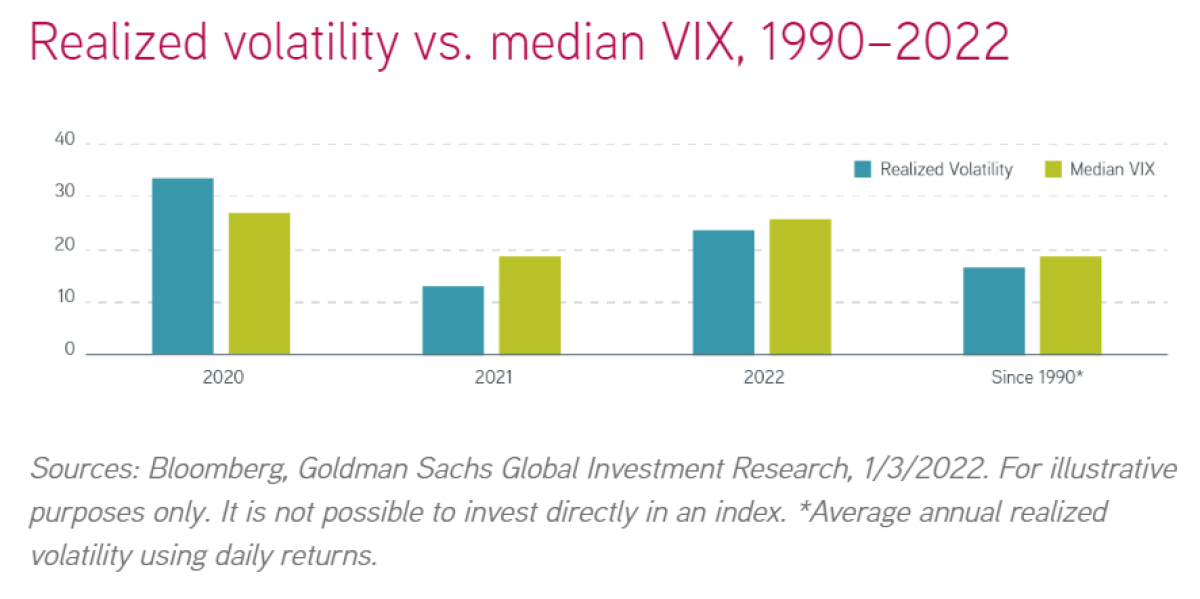
The chart below shows that realized volatility nearly doubled from 2021 to 2022 and was significantly higher than average since 1990. However, the median VIX in 2022 remained higher. Using that measurement, investors accurately forecasted the higher volatility.
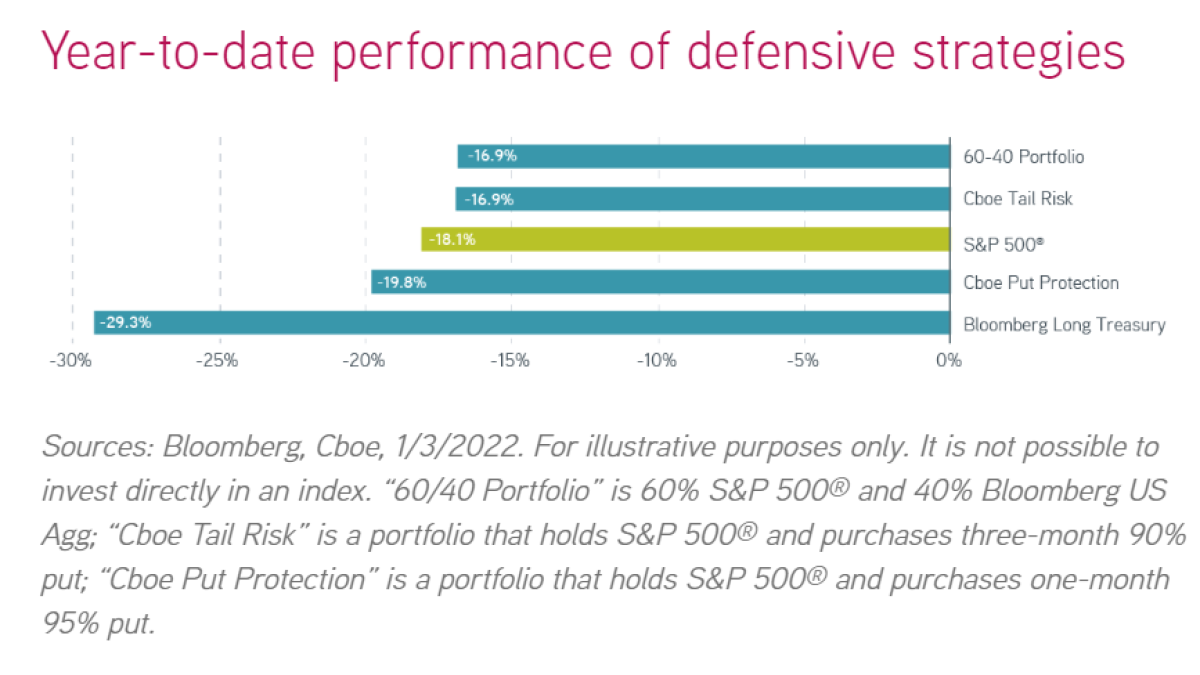
Most equity hedges via put options didn’t perform as expected in 2022, driven by the orderly selloff (often followed by reversals) and a positive implied-realized volatility spread (options were expensive). The Cboe Put Protection index, for example, which buys 5% out of the money (OTM) one-month puts to protect the underlying long equity, lost more money (-19.8%) than the S&P 500® (-18.1%) in 2022. Many other defensive strategies that performed well in previous years, like a typical 60/40 equity/fixed income portfolio and Bloomberg Long Treasury, failed in 2022.
What is the flattening skew?
Looking deeper into the VIX, we found that a phenomenon called flattening skew impacted the value of the index. The VIX is based on the pricing from various options to measure the market expectation of future volatility. The weighting and pricing from each component impacts the value of the VIX. Let’s compare two S&P 500® implied volatility curves used for pricing one-month options, one from December 2021 and another from December 2022.
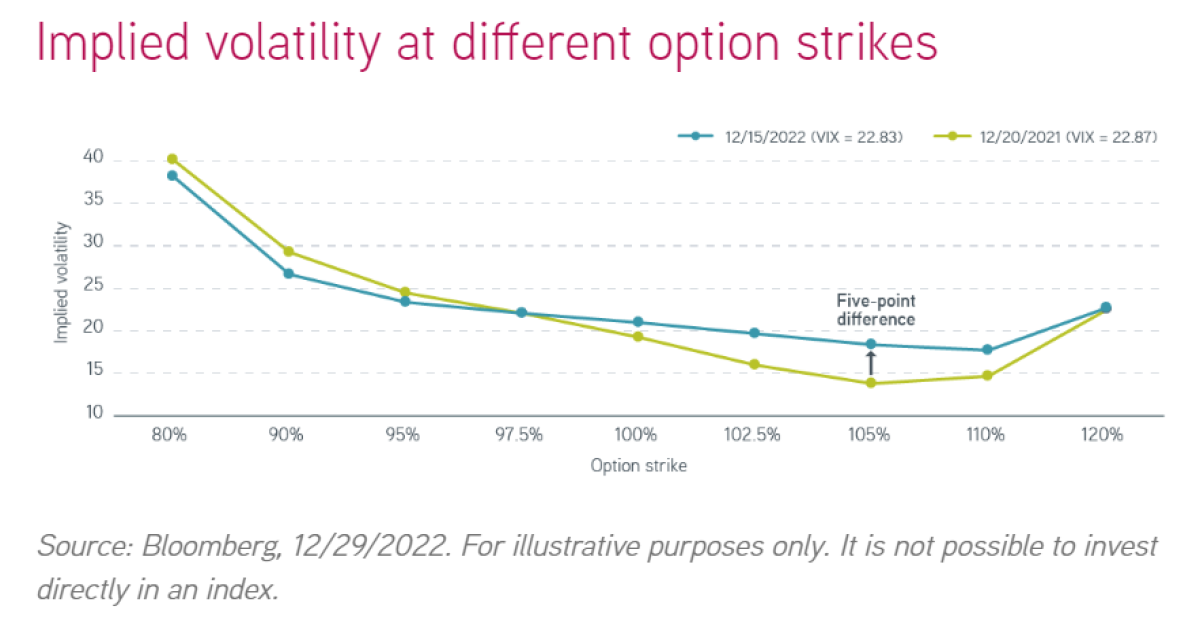
A reader might guess that overall implied volatility was higher for the teal line than the green on first look. This might be true if we average the value of all the dots on the curve. However, the VIX on those two days is nearly identical. A key feature of the VIX is that constituent options are weighted inversely proportional to the square of their strikes. Therefore, put options—which have a lower strike—affect the value of VIX more than call options that have a higher strike. Plus, like the above graph, the equity implied volatility curve is typically downward sloping, meaning OTM puts (like 95%) have higher implied volatility than the respective calls (like 105%). The 95% put contributes more to the variance in the VIX calculation than the 105% call.
The skew measures the difference between the implied volatility of OTM puts and calls. A flattening volatility skew means that either puts are relatively cheap or calls are rather expensive.
What could have caused the cheap skew? The market already declined significantly in 2022. Therefore, how likely is it that we’ll see another 10% downturn? On the contrary, there’s more demand for upsides. It was also well-discussed that 2022 was an orderly, well-anticipated, well-hedged sell-off. Investors don’t need to buy more puts. Structured and exotic options products, like the volatility knock-out (VKO), created the need for dealers to hedge their volatility positions when market trades lower without volatility picking up. We experienced this in 2022, and it added to downward pressure on the skew.
Which options-based strategies are more attractive?
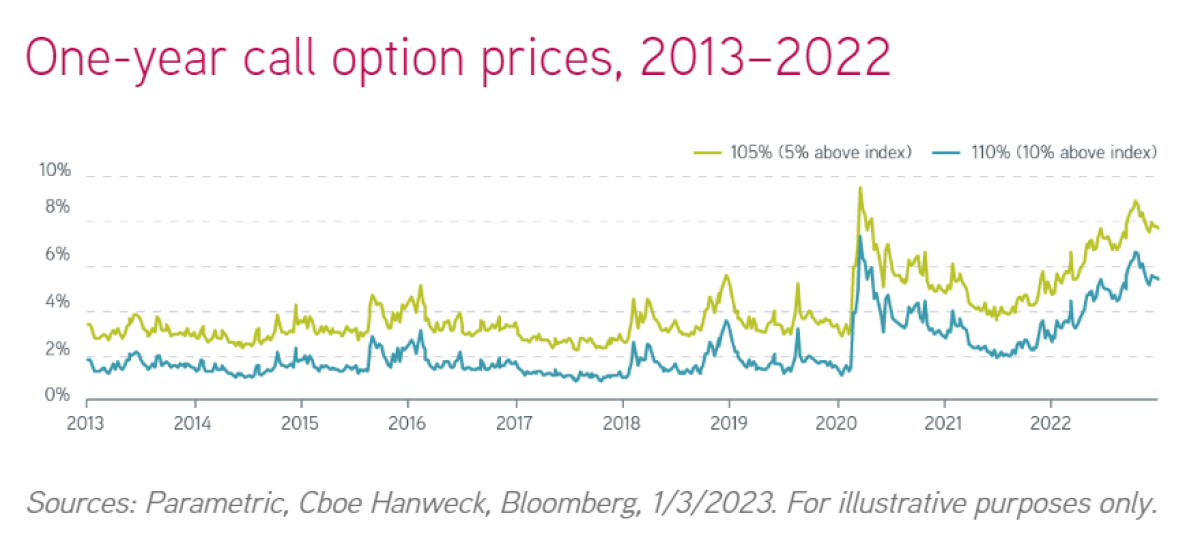
As investors’ concern has shifted from inflation to recession in 2023, the S&P 500® is still trading at a projected earnings per share level higher than in 2021. Call-overwriting strategies can be attractive in the current macro environment for investors who remain cautious about equity returns, thanks to higher short-term interest rates. Higher interest rates mean higher forward prices, since options are based on forward underlying prices that result in higher breakeven (or caps) for call options. We show in the chart below that the price of 105% and 110% (5% and 10% above the index) S&P 500® one-year call options approximated 8% and 5.5% at the end of 2022. The investors’ breakeven points are 13% and 15.5% (strike plus option premium) before dividends, if they hold the underlying index and write call options against the stock position.
The bottom line
Implied volatility was higher than the realized in 2022 on average. A tailwind for volatility risk premium and options-selling strategies. Common options-based equity hedges weren’t effective in protecting portfolio drawdowns in 2022 in contrast to previous years.
And all things equal, flattened volatility skew suppressed the value of the VIX—a useful benchmark—but that’s not the whole story. Pricing for specific options-based strategies improved even under the “same” VIX. For example, an options-selling strategy that sells a balanced puts and calls versus only puts. So it’s crucial to understand the mechanics of each options-selling strategy.
That’s why we think investors can use call selling to seek to generate historically attractive premium income (agreeing to a cap) or as part of a protection structure (like a put-spread collar), where relatively rich calls may offer improved financing for downside protection when the volatility skew is flat.
Check out Parametric's take on Direct Indexing
About the Author:
Perry Li is responsible for the analytics, development, and evolution of Parametric’s Volatility Risk Premium Strategies, including Defensive Equity and other proprietary strategies. He’s been a guest speaker at the International Association for Quantitative Finance (IAQF) and an instructor and mentor for the University of Minnesota financial mathematics program. Prior to joining Parametric in 2014, Perry worked for CHS, where he managed commodity futures and options portfolios and conducted research on the macro economy and derivative strategies. A certified FRM and CFA charterholder, Perry is a member of the CFA Society of Minnesota.
