
By Dan Weiskopf, Toroso portfolio manager and member of its investment committee. He is both the lead ETF Strategist for the ETF Think Tank and the Co-Portfolio Manager of the Amplify Transformational Data Share ETF (BLOK).
Broad Market
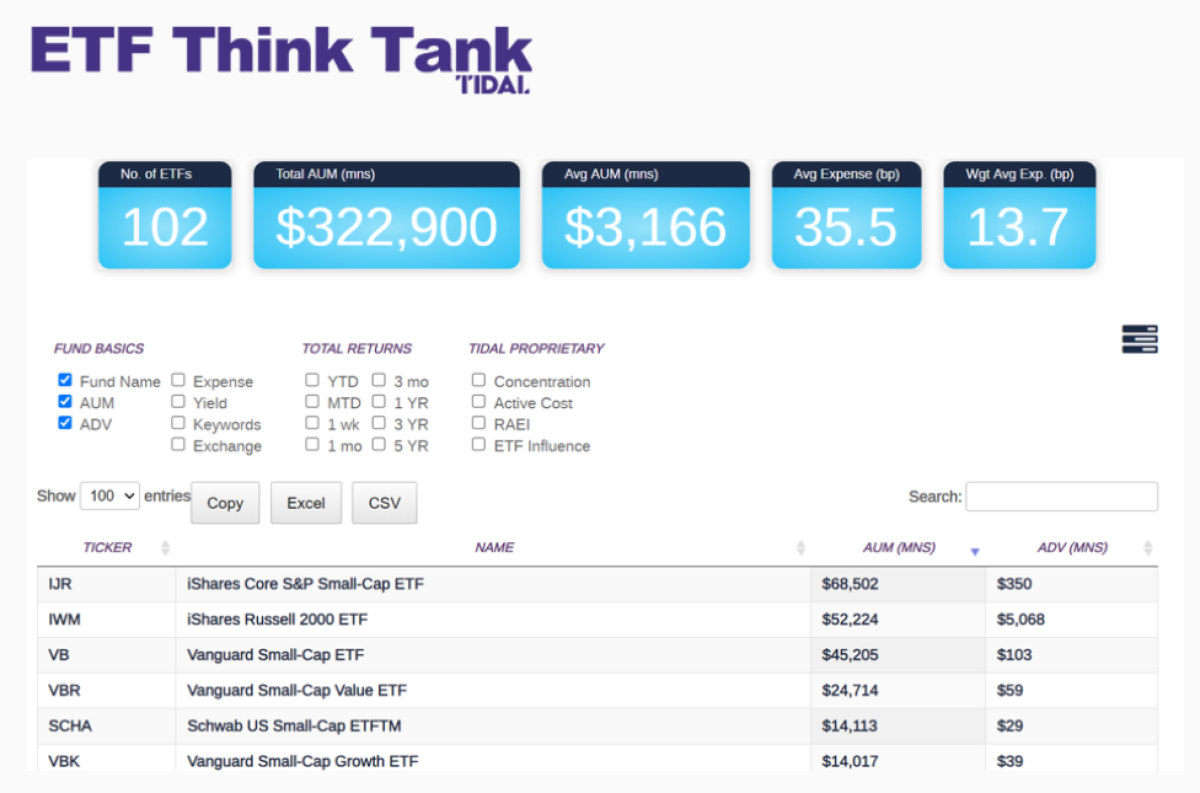
The success of small businesses is essential to the U.S. economy, but this obvious fact is not clearly reflected in the US stock market. Broad small-cap stock performance YTD looks to be in the range of 4-6% versus SPY at about 17.2% and the QQQs at a staggering 39.66%. However, with $323 billion in ETF Assets Under Management (AUM) and 4.38% of the overall ETF market, this investment category cannot be ignored.
The evidence of why small company success is critical to the strength of the US Economy is highlighted in an article by Luisa Zhou. Key points are highlighted below:
- There are 32.5 million small businesses in the U.S.
- Small businesses account for 64% of new jobs annually, and they create 1.5 million jobs in the U.S. each year. According to the SBA, 2 out of every 3 jobs created in the past 25 years was by a small business.
- 99.9% of businesses in the US are small businesses.
- The number of U.S. small businesses has doubled since 1982, which arguably has implications for employment, real estate, and services. Small business represents about 46.8% of jobs in America.
- While declining, small businesses generate 44% of U.S. economic activity, measured by GDP.
Of course, investing in small businesses with 10-100 employees is different than investing in small-cap stocks that are, depending upon the index provider, broadly defined as having a market cap of $250M to $5 billion, but the point remains the same. America’s economy is more dependent upon the success of smaller companies than the top 100 companies by market cap value. This is why we need stock market breadth to broaden out as evidence that investors truly have confidence that the overall economy is expanding in a healthy way rather than teetering on a recession.
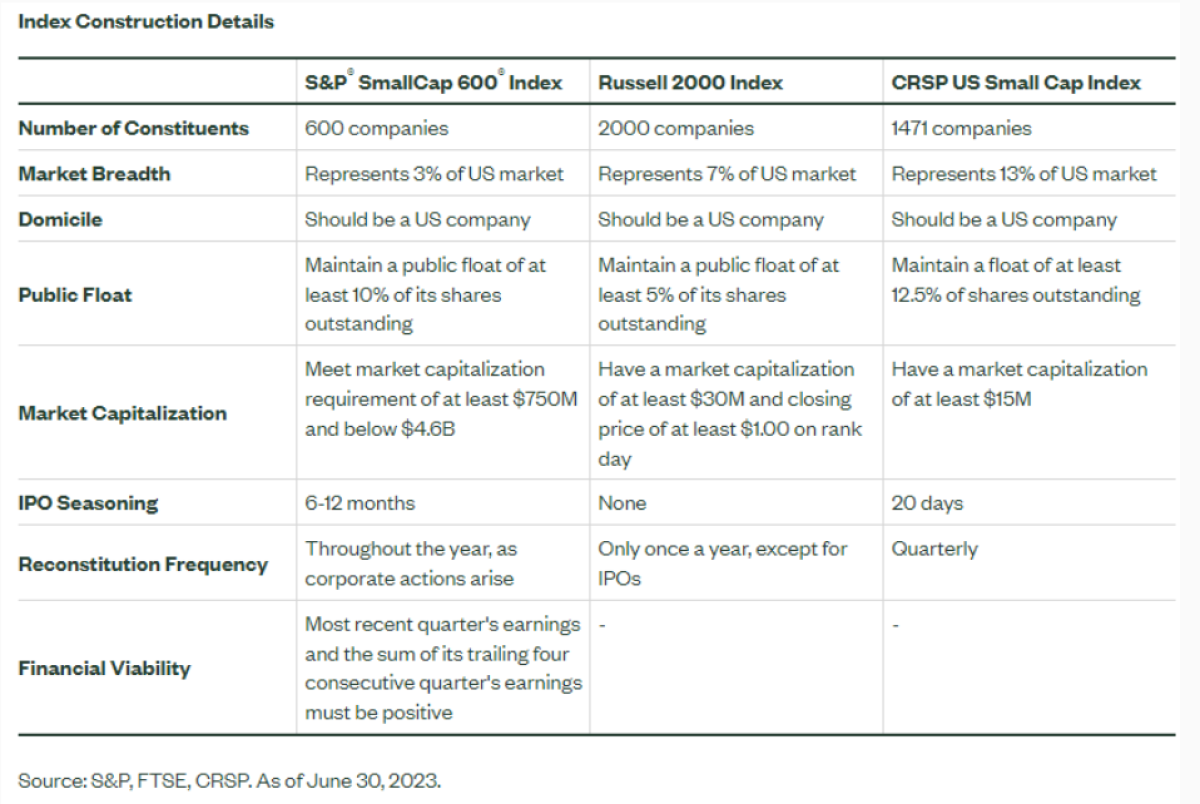
In the world of ETFs, the definition of small-cap is not always clear. Some index providers see small-caps as $250 million to $2 billion in market value, while others see the value as $585 million to $5 billion.[i] For further clarity, we suggest financial advisors review the insight piece by Matthew Bartolini, Head of SPDR America’s Research, titled “How Big Differences in Small-Cap Benchmarks Set the S&P Small-Cap 600 ® Index Apart,” which also highlights the differences graphically between the three major passive indexes.
For these reasons, we think it is constructive to focus on small-caps in September, which will also include a scheduled Think Tank Exchange at 10 am ET on September 27 (register now at www.thinktankexchange.com).
In the financial industry, truth in labeling is an issue and an opportunity, well beyond just ESG. The label of “small-cap” is overly simple, as it often refers to a small-cap blend and often overlaps with mid-caps. To this point, we appreciate Matt’s explanation and chart (see above). The definition provided by index firms like the Center for Research in Securities, LLC (CRSP) is not always so clear. When someone invests in the Vanguard Small-Cap ETF (VB) what exactly are they getting? A Small-Cap Blend or a Small-Cap Fund? We did not consult an SEC attorney, but the definitions between CRSP and Vanguard do not quite line up with great clarity.
- The fund says “Vanguard Small-Cap Index Fund seeks to track the investment performance of the CRSP US Small Cap Index, an unmanaged benchmark representing small Us companies.”
- The CRSP index says “The CRSP U.S. Small-Cap Index includes U.S. companies that fall between the bottom 2% to 15% of the investable market capitalization.” Readers may see that the index reconstitution is on September 19 and may want to refer back to the link for further clarity on the index methodology.[ii]
To think there are over $125 billion of AUM that blindly track this index simply because they are “unmanaged” and cheap. Vanguard’s mutual fund (VSMAX) and ETF (VB) both track the same index.
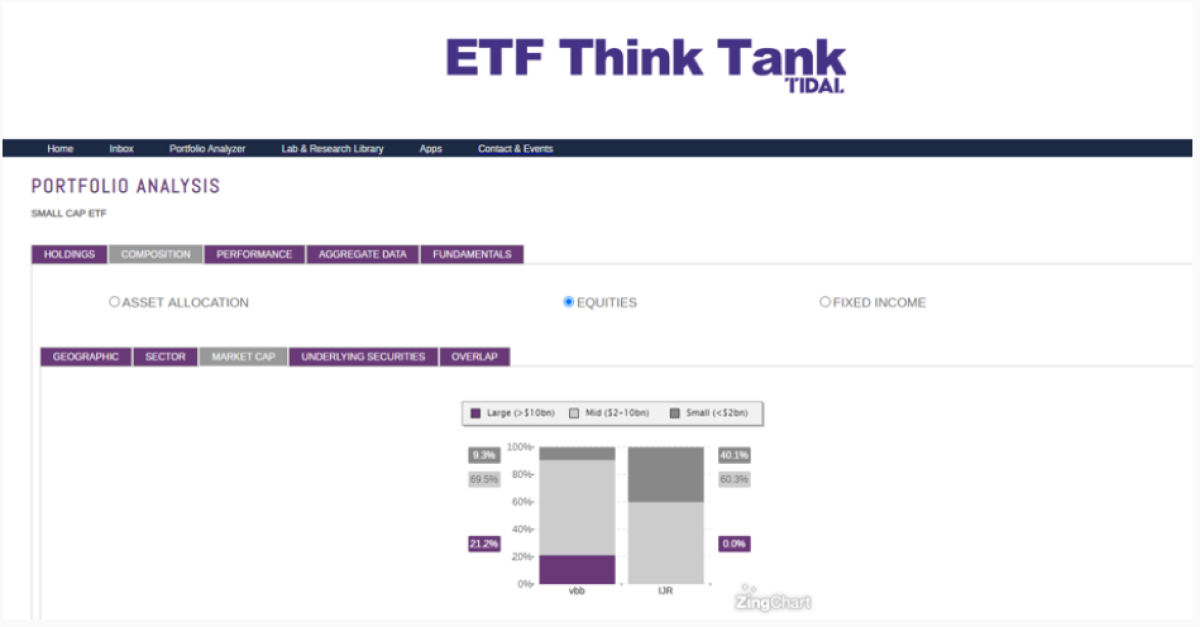
To this point, we would highlight that the two largest “small-cap ETFs” that trade under the tickers VB and IJR really skew towards “mid-cap,” at 69.5% and 60.3% respectively. VB even has 21.2% exposure to large-cap companies with market cap of > $10 billion. (Let’s watch what happens during this upcoming rebalancing!)
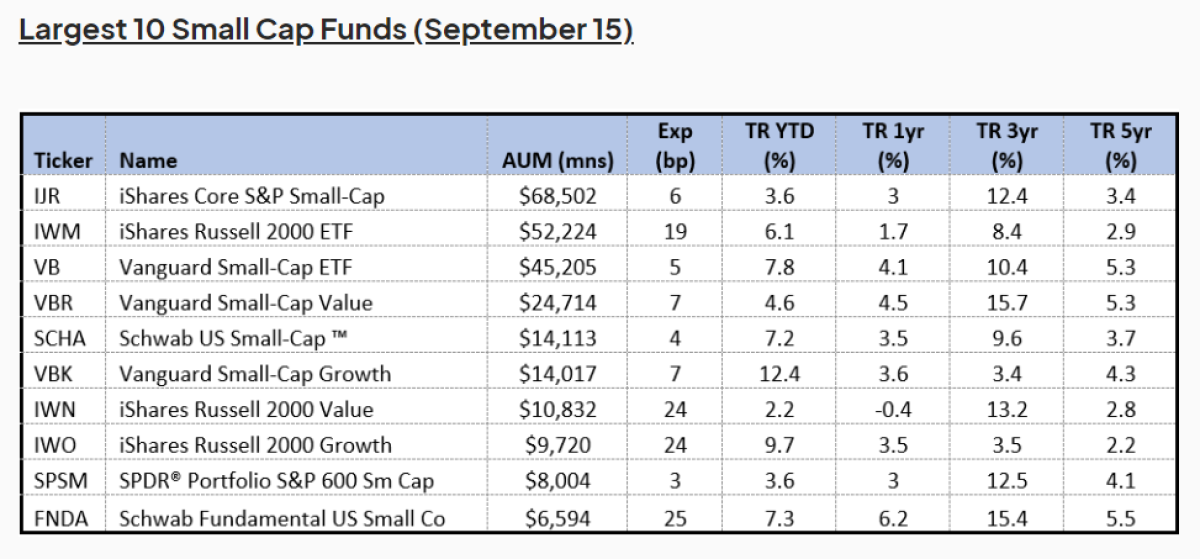
We would also highlight that nearly 79% of the AUM in small-caps are in the top-10 largest funds which amount to $253 billion of the ETF’s AUM. [iii] Note that 3 of the funds, or 33% of the top 10 ETFs, are in Vanguard Funds, which frugal readers may be surprised to find out are not in fact the cheapest funds. On August 1, 2023, SSgA announced a significant reduction in total expense ratio (TER) across 10 low-cost funds, with the lowest fee at 2 Bps (SPLG)
Tank members who frequently use the Comparison Tool will also note that the SPDR Portfolio S&P 600 Small Cap ETF (SPSM) overlaps 98% with the I-Shares Core S&P Small Cap (IJR) and 96% with the Vanguard S&P Small-Cap 600. Even over a lifetime, 5-10 Bps may feel cheap if returns compound at 300-800 Bps, but why pay 2x to 3 more for VIOO when SPSM is offering the same index at 3 Bps?
Hidden Gems: Targeting Performance
5 years Best and Worst Performing Small-Cap ETFs (September 15)
The ETF Think Tank Tools are useful in downloading information across many different metrics. In fact, users can enjoy 18 different ways to compare small-caps if they want to have an overload in KPIs. Doing such work, of course, means your objective is to outperform the cheap broad beta. Such a goal may take extra due diligence, but there seems to be plenty of opportunity as well as meaningful rewards. Moreover, we sense there is a trend towards a focus on cash flow, high active share, and momentum as leading factors for outperformance. A hidden gem to watch will be $DSMC.
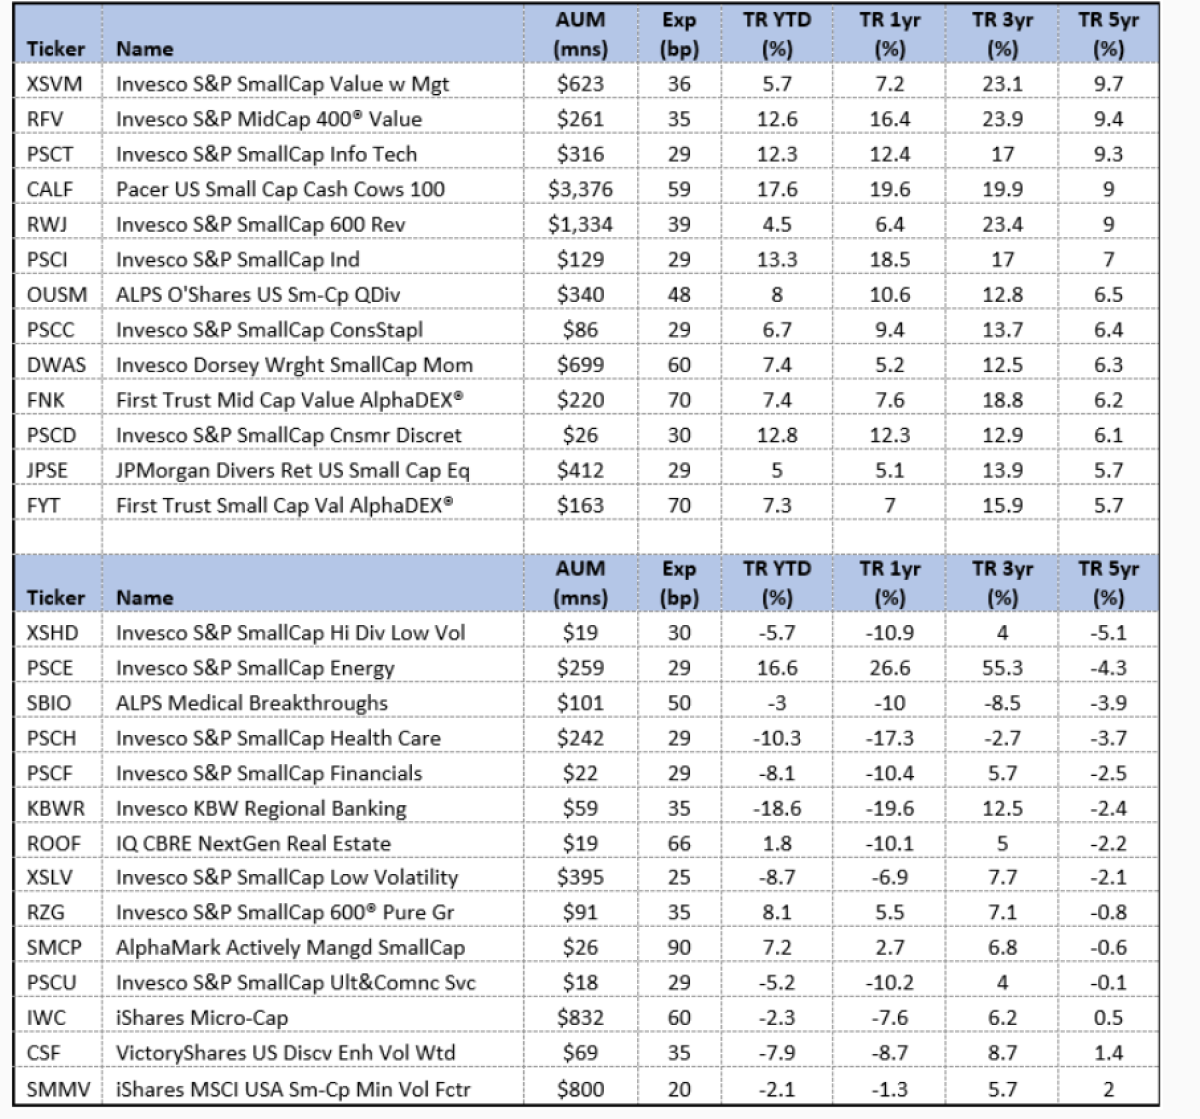
In 5 years, will free beta still dominate? We get that many investors need to emphasize what they can control, aka the fee they pay. However, discerning investors may be compelled to look closer at what is materially outperforming and risk paying up for the opportunity to capture an extra 400 to 600 Bps. (5 yr 3.4% vs 9.7%) Put differently, investors in XSVM would say saving pennies while giving up dollars may not have been a wise choice.
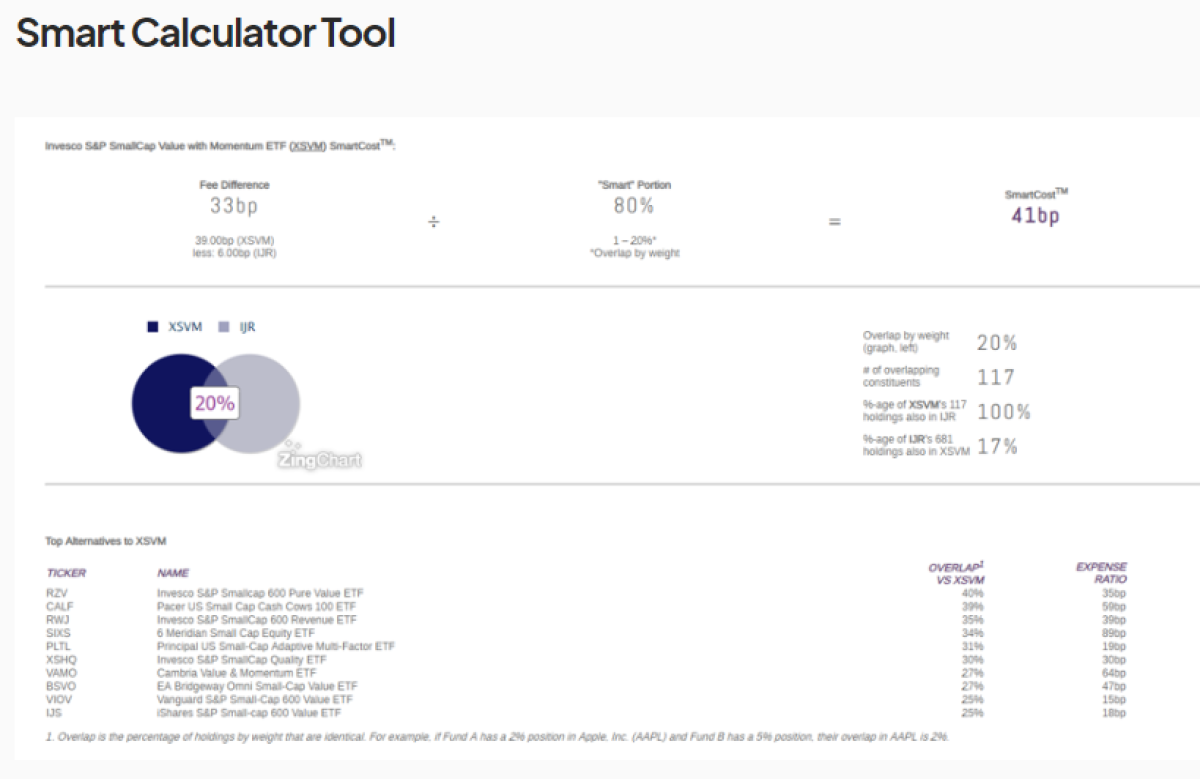
Bottom line: Using the ETF Think Tank Smart Cost Calculator and comparing the 39 Bps paid to Invesco for XVSM, we get a score of 41 Bps on the 80% Active share. The 41 Bps is calculated based upon the 33-fee difference. Arguably, this is what “Smart Beta” should be measured by, especially since the ETF delivered Alpha over the lower cost cheap Beta.
Real Life Tank Battle Ground Stories
Thank you, Jake Rue, of Shore Point Advisors. You are a great example of a Tank member, especially since you recently shared your own insights written from August 2022. Your analysis of the different factors provided across 8 different funds was helpful, especially as you added analysis related to the Sharpe Ratios and Volatility. Again, this can kind of be analyzed using the ETF Think Tank Tools for those who care.
Summary
If you are a strategic investor and just want to control cost, the good news is that TER are almost free for small-cap access. However, understanding the mysterious index methodology still requires a discerning eye and the use of effective tools. After all, when the definition of small-cap ranges from $250 million to $5 billion, the return outcomes can be very different. Moreover, for those looking for Alpha, please use our tools to distinguish what “Smart Cost” really is and which funds have high active share. To us, this means that over the next 5 years, the concentration in AUM in the top 10 small-cap ETFs will not be 79% of the aggregate. Why? Watch out Vanguard – cheap beta may be sticky, but they are coming for you on price! Sometimes you get what you pay for, and cheap TER can also lead to underperformance when structure matters.
[i] https://www.investopedia.com/insights/understanding-small-and-big-cap-stocks/
[iii] Excludes like kind passive mutual funds
About the Author:
Dan Weiskopf is a Toroso portfolio manager and member of its investment committee. His career started in 1987 working for a family office. Later he managed a hedge fund called MH CApital that was focused on small-cap stocks (1995 to 2003). In 2003, he began writing about ETFs. He was a Financial Advisor at UBS beginning 2003 up until 2009 at which point he went independent as an RIA. On May 2018, he joined Toroso, which is now also known as Tidal Financial Group as a member of the investment committee. He is both the lead ETF Strategist for the ETF Think Tank and Co-Portfolio Manager of the Amplify Transformational Data Share ETF (BLOK).