

By Linus Nilsson, founder of NilssonHedge, a hedge fund database.
In this exploration, we study the difference between the Sharpe and the Sortino ratio. These two popular ratios are often used in factsheets or when discussing managers. In the end, we find that the choice is largely irrelevant. If you have a favorite ratio, now is the time to revise that belief.
With regard to performance ratios, some investors strongly believe in one type of measurement over the other. One example of a debate that is occasionally ongoing is the difference between the Sharpe and Sortino ratios. A plethora of other ratios exist, but most performance-based ratios use some variation of return over risk. While outside the scope of this post, they tend to give very similar results when used to rank managers.
Sharpe & Sortino
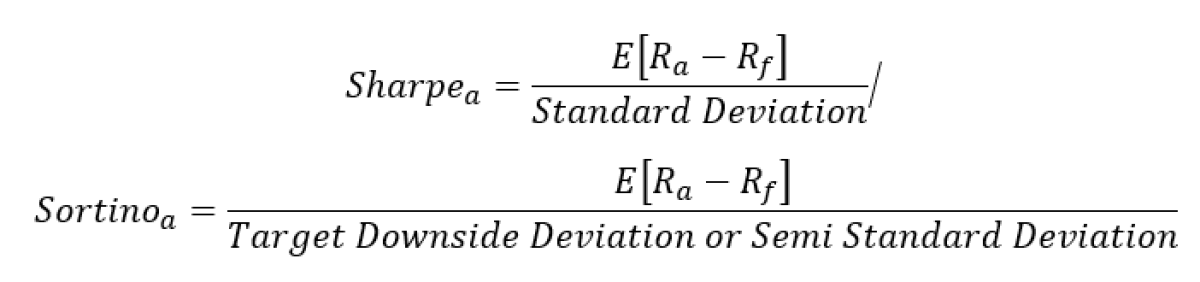
As we will demonstrate, the choice between these two ratios is largely irrelevant. From an input perspective, these ratios consume the same type of data, and while the Sortino ratio is focused on the downside, it is a subset of the data set user for the Sharpe ratio calculations. The incremental information is small and the Sortino only looks at approximately half the sample. Unless you have long time series, the Sortino ratio is less information-dense and by definition less significant.
For the nominator, we use geometric (compounded annualized) returns, even though arithmetic returns may be better as the compounded return is affected by the volatility level.
To illustrate the lack of difference, we calculate the Sharpe and Sortino Ratios across all currently reporting managers in the NilssonHedge database. For the Sortino, we also calculate two variations, one using the Semi Standard Deviation (ignoring positive returns) and one using the Target downside deviation (replacing positive return with zeros).
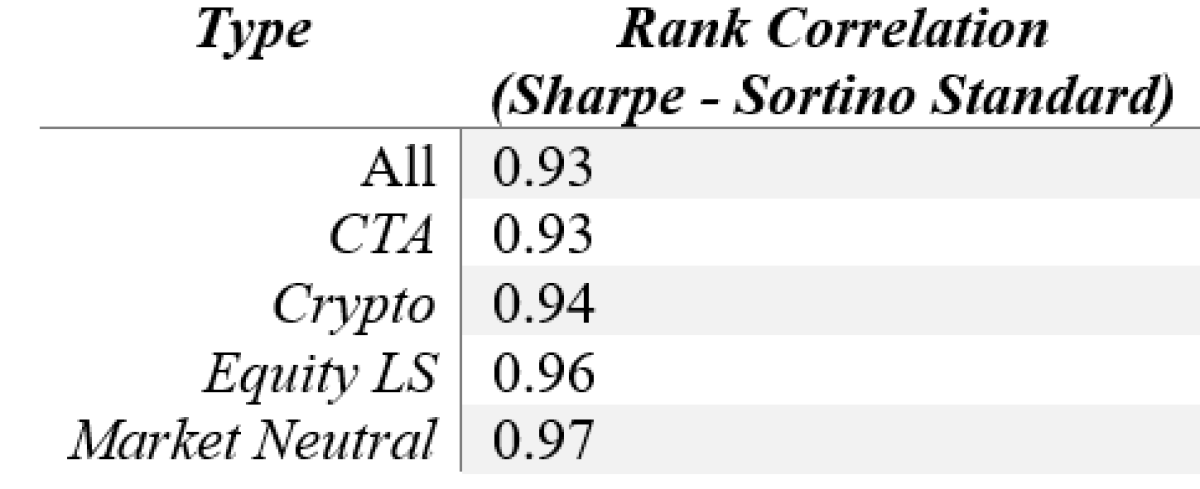
From the table above, we observe that the measures are highly correlated while simultaneously noting that we have not adjusted for the length of the track records, and some of the outliers are due to (very) short track records. Adjusting for that, the measure would align even more. That is an exercise that we leave for the interested reader.
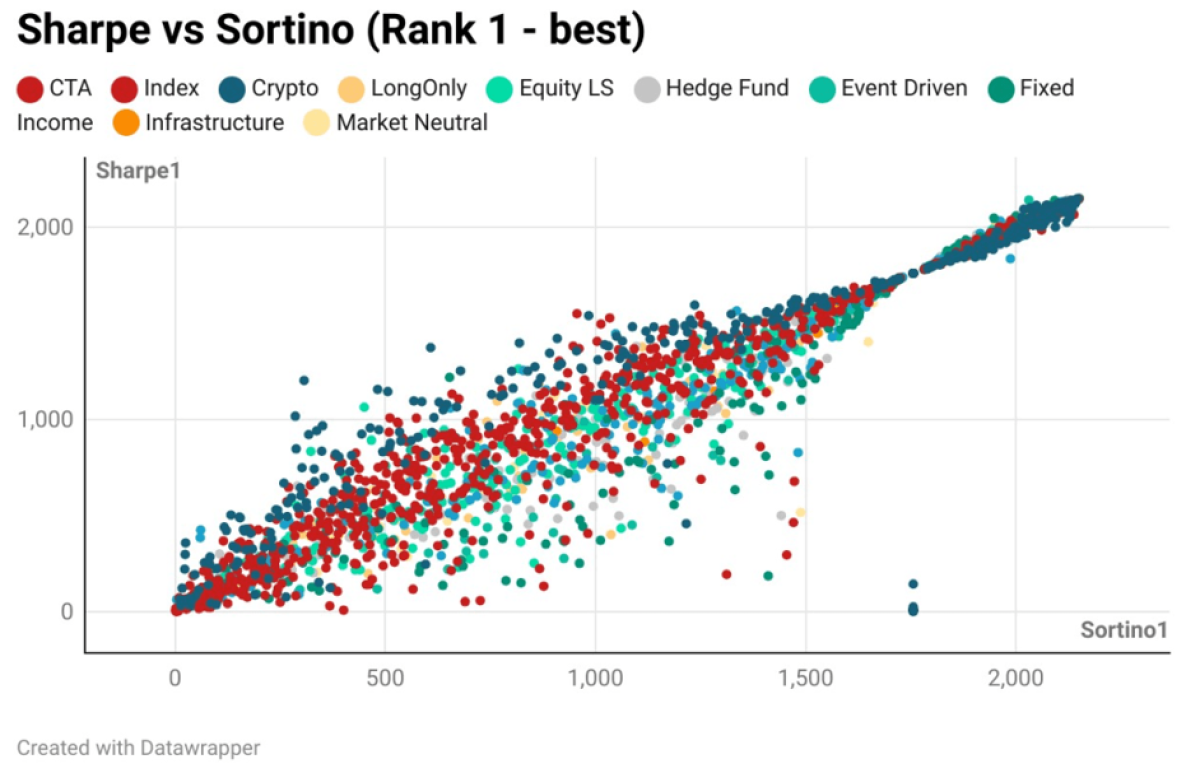
With one of the most data-dense charts we have made, we plot the ranks by Sharpe and Sortino and compare them to each other across more than 2,000 funds. Visually, we can confirm that the ranking is highly correlated. The outliers tend to be for track records with "special" features, typically short track records with an insufficient number of observations. What is perhaps interesting is one type of strategy does not have a materially different outcome depending on the ranking measure.
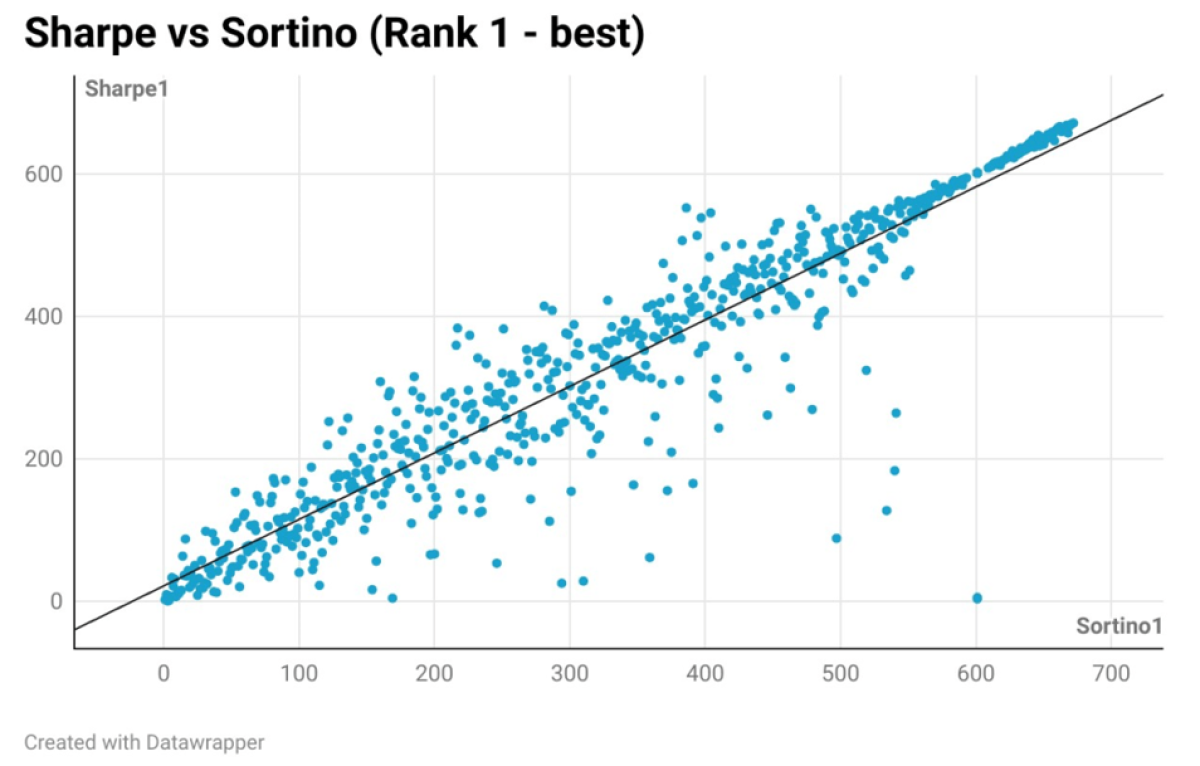
From a visual perspective when only looking at the CTA subset, the message is the same. Highly correlated observations. We could have imagined that one type of strategy would always have a better ranking if it was said persistently positively skewed.
The off-the-line observations are managers with short track records or managers using option strategies (that would rank high on Sharpe, but not Sortino post an event) and potentially simulated returns without any significant downside.
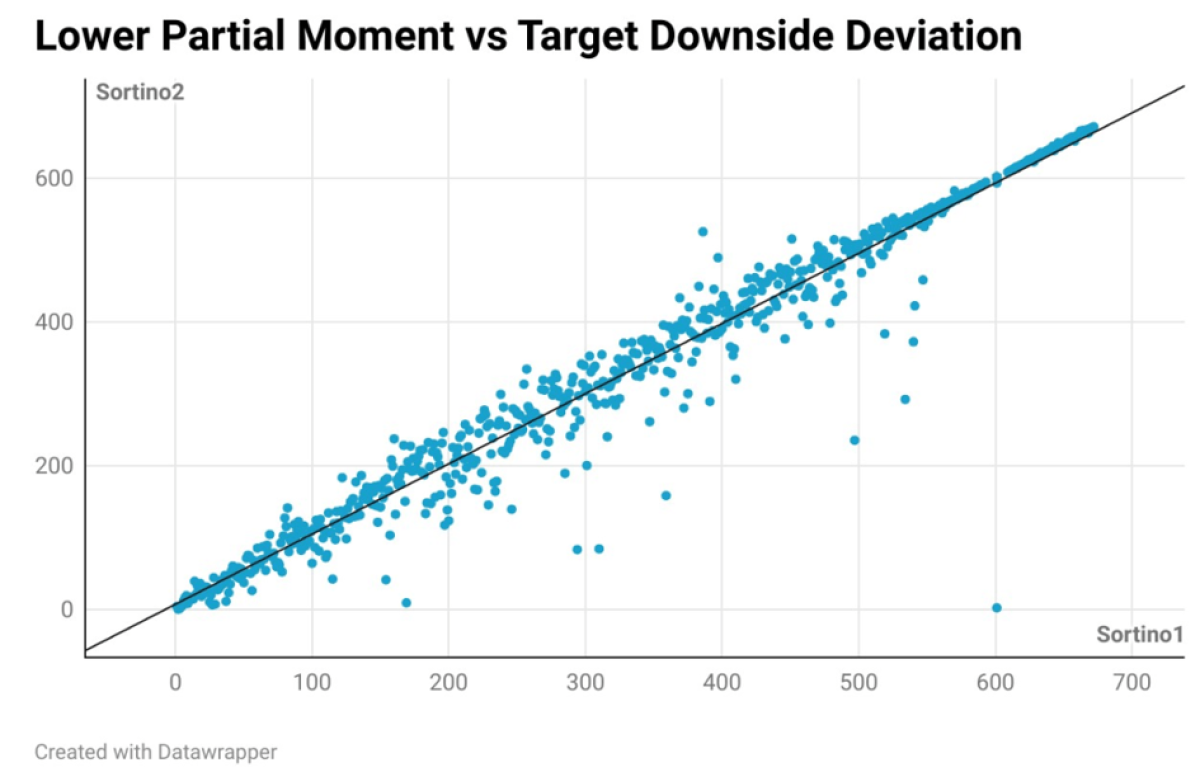
Two different formulations of the Sortino
As our last experiment on the difference between the ratios, we ran the two different formulations of the denominator for the Sortino Ratio for CTAs. While we note one or two outliers, an overwhelming majority of the observations fall on the linear regression line.
So, when ranking strategies by any performance ratio, most measures will arrive at the same relative result. The top-ranked managers will differ slightly, but within the top 10-20 names they are mostly the same names. You cannot catapult yourself into a better ranking by picking a particular (standardized) performance ratio.
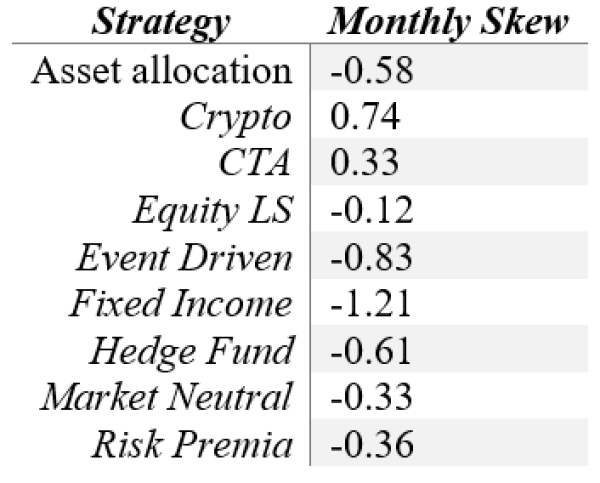
Skews for Hedge Fund Strategies
CTAs do have a more positive skew compared to other strategies, but using the Sortino over the Sharpe ratio to tease out that difference seems to be the wrong tool. We note that Crypto managers have an even larger positive skew, but that is largely due to the time period over which the measure is calculated.
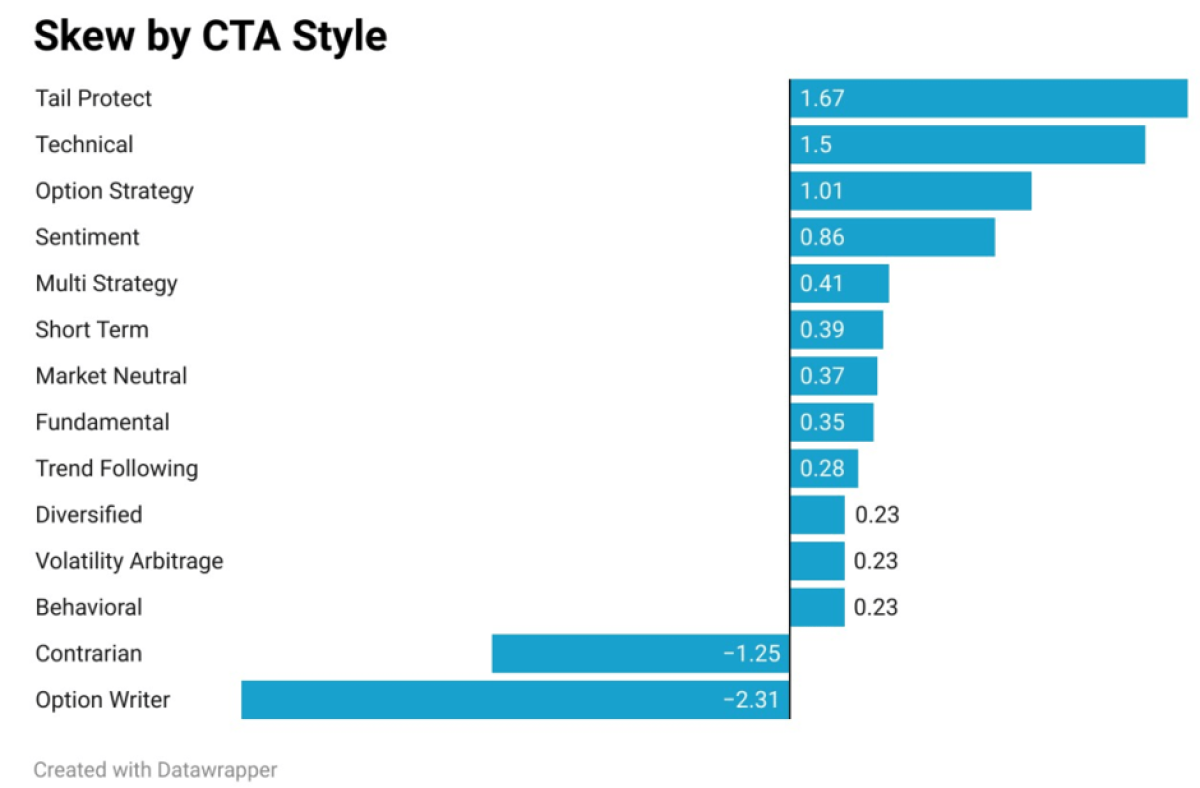
As our final note, we also calculate the skew by CTA trading style. Tail Protect strategies rank the best, i.e. large positive outliers with smaller negative returns. Surprisingly, the Trend Following strategies are in the lower half of the sample. Short Term strategies do for instance rank better.
Simply put - the Lower Partial Moment is the standard deviation of negative returns while the Target Downside Deviation replaces numbers above a threshold with zeroes (here we replace positive returns with zeroes). The difference between them is that the Lower Partial Moment only looks at approximately half the sample and may exaggerate the downside of a strategy. The Target Downside Deviation should in theory be better for strategies with infrequent losses as it will properly reflect the nature of those strategies. In practice, as we will show, we find that the two methods result in similar rankings.

Final words
In summary, the ratio selected does not matter. You are using the same dataset, sliced and diced somewhat differently. In our opinion, the Sharpe ratio is most likely the more intuitive as it uses the whole data set and provides a quick relationship between (historical) returns and risk.
All posts are the opinion of the contributing author. As such, they should not be construed as investment advice, nor do the opinions expressed necessarily reflect the views of CAIA Association or the author’s employer.
About the Author:
NilssonHedge is operated by Linus Nilsson, an experienced allocator who has spent close to twenty years investing in Hedge Funds (both privately and for institutions) or operating systematic strategies, as a startup but also as the CIO of a smaller European CTA.
Mr. Nilsson founded NilssonHedge, a hedge fund database, as an initiative to bring transparency to the hedge fund universe. The database combines an innovative way of aggregating public performance data with cost-efficient access to hedge fund returns.
