

By Wu Guowei Jack, CFA, CAIA, Director, Content APAC, CAIA Association
2020 was a boom year for Special Purpose Acquisition Company (SPAC) listings. An annual total of US$ 83 billion was raised, accounting for 46% of total US IPO proceeds and 55% of the total number of US IPOs. The momentum has continued into 2021 with a record-breaking US$ 100 billion raised as of April.
The total amount raised in these last two years account for over two-thirds of the total amount raised by SPACs in the last two decades[1]. This marks an inflection point for SPACs as they changed from a niche listing option to a mainstream listing option.
Investors who participated in the U.S. SPAC market in 2020 likely generated good profits. These investors often bought pre-merger SPACs near to their listing price of US$10. When the SPAC announced a pending deal, investors could enjoy an average return of 40 percent (see Chart 1 below), in a matter of months.
Will this pattern continue? We believe investors should consider the points below before putting their money into SPACs.
THREE DISTINCT RISK-RETURN PROFILES
It is important for investors to recognize that the lifecycle of a SPAC has three distinct phases: pre-announcement, announcement, and post completion. The risk and return profile for a SPAC varies in each phase.
Chart 1 below shows a recent study by Nasdaq, which looked at the performance of SPACs that held an IPO after 2018 and successfully completed an acquisition between 2019 and 2020. It made the following conclusion for each of the three phases:
- Pre-Announcement Phase: Before the announcement of any acquisition, the SPAC typically has bond-like returns with low volatility. Most SPACs go public at US$10 per share and trade around that price, because 90% or more of the gross proceeds from the SPAC IPO is in a trust earning bond-like returns.
- Announcement Phase: When an acquisition target is announced and before completion, there is likely to be a jump in price. On average, SPACs showed a 40 percent jump in price. However, not all SPACs would have this jump in price as it depends on the acquisition target and its valuation. In fact, the median SPAC showed only a slight price increase. The median SPAC return remains largely unchanged, as shown by Chart 1.
- Post-Completion Phase: In contrast to the high return in the announcement phase, the return for the post-completion phase has been disappointing. One month after completion, about 50 percent of the SPACs under study had negative returns, while there were a few big winners with over 50 percent returns. The return profile for this group stabilises thereafter. Twelve months after completion, about 45 percent of SPACs had negative returns and about 30 percent of the SPACs had returns greater than 100 percent.
Chart 1
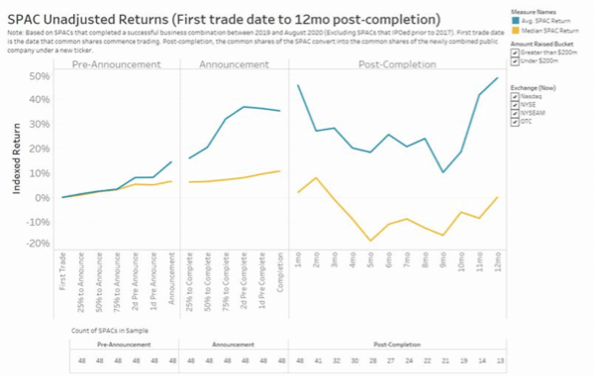
Source: Nasdaq. A Record Pace For SPACs.
One of the factors for the post-completion performance are dilution effects from promote, warrants, and redemption. Sponsor will take a promote which is typically 20% of the SPAC’s post-IPO equity.
In addition, the exercise of warrants dilutes existing shareholders. Dilution reduces the proportional stake of shareholders, who continue to hold the stock without exercising any warrants.
Finally, redemption [2] further increases the amount of dilution caused by the promote and the warrants. SPACs replenish the cash they lose to redemptions by selling new shares through private placement (PIPE), which are often priced at a discount to the SPAC’s publicly traded price. The greater the degree of dilution, the more likely the company is to underperform after the SPAC’s public listing.
Another key factor is whether the SPAC is led by an investor or operator. A McKinsey study showed that the underperformance is concentrated in SPACs led by sponsors who come from the investing community.
On the other hand, SPACs led by operators, such as CEOs who have led companies in the industry of the target company, have relatively outperformed.
COMPARISON TO TRADITIONAL IPO
The jump in the SPAC price during the announcement phase has similarity to the price jump on the first day trading of traditional IPO, thus some investors may be keen to take a chance. But investors must recognize the differences between a SPAC and the traditional IPO. One key difference is that traditional IPO pricing is based on the historical financial track record of the company. In contrast, a SPAC combination can provide forward-looking financial statements to justify their valuation. In our earlier article we mentioned the danger of such disclosure.
COMPARISON TO PRIVATE EQUITY
Some may compare SPACs to private equity where the sponsors offer their track record as a proxy for the success rate in finding a good target company. Investors must recognize the difference in upside sharing. For a private equity investment, the sponsor, or GP, typically shares 20% of realized profits. If the private equity fund is unable to sell the portfolio company at a profit, the fund manager does not receive any incentive fees or the carried interest.
The SPAC sponsor will take a promote, which is typically 20% of a SPAC when a deal is successfully completed. This means a sponsor who raises a US$ 300 million SPAC—a typical size of SPAC—will receive 20% of its common stock initially worth US$ 60 million, if they complete a deal, whether the newly merged company’s stock goes up or down when the transaction closes. Even if the stock falls 30% after the deal closes, the sponsor’s common stock will be worth US$ 42 million. This is over a 1000x multiple of the US$ 25,000 invested by the sponsor, a stark contrast to the 30% loss by the investor. We note that in many cases, US sponsors invest at least 2 percent of the proceeds of the IPO, which is meant to offset the underwriter's fee so that the full proceeds of the IPO can be placed in the trust account.
UNDERSTAND DIFFERENT INVESTORS’ MOTIVATION
Prior to 2020, the SPAC market was considered niche as the average SPAC size was small and did not attract the attention of institutional investors. However, there was a small group of institutional investors who were attracted to the arbitrage-like characteristics in SPAC structure, which we had explained in our earlier article.
These investors (we shall call them first-gen SPAC investors) like the bond-like nature of SPACs in the pre-announcement phase and the potential upside from the warrants that come with the SPACs units.
The strategy for these first-gen SPAC investors is simple. They assign a small part of their treasury allocation to SPACs. Then, they buy the SPAC units at US$ 10, sell the warrants for whatever price they can, and redeem the stock for US$ 10. The alpha in this trade comes in the selling the warrants.
In 2020, several high-profile private companies, like Draft Kings, Luminar, Iridium, and Virgin Galactic, decided to go public via SPACs. This could be due to COVID-19 disrupting the traditional IPOs in terms of travel restrictions affecting investor roadshows.
The SPACs initially showed a small pop when the announcement of the merger was made. Some of the target companies have a well-known brand or exciting themes and thus attracted a large amount of retail money, pushing the prices even higher during the announcement phase. Furthermore, there was not a large supply of shares in the market as most of the investors that had invested in SPACs had planned to hold their shares until they redeem or sell at the de-SPAC date.
On the other end, large institutions who invest in public equities were caught in a situation where they are under allocated in a stock that they needed or wanted to have in their portfolio.
These large institutional investors are often anchor investors in a traditional IPO where they will sign up for large block of shares, often at a discount to publicly traded price. They then turned to PIPE to secure the stake that they needed. This in turn provided the capital needed to close mergers and the quality of investors that were attractive to private companies considering SPACs.
Finally, the hedge funds who are constantly on the lookout for arbitrage opportunity realized there is an opportunity to buy SPAC units at US$ 10 with downside risk protection since the assets are in a trust earning interest. They could then sell the SPAC for US$ 12 on the announcement, generating a relatively risk-free 20%+ return.
Some of them would also apply leverage which amplify the returns. In 2021, there were over 100 SPACs within the first quarter, and around 75% of institutional investors in these SPACs were hedge funds. The hedge funds, unlike the first-generation SPAC investor, plans to aggressively sell their shares on the announcement pop.
The dynamics of the first-gen SPAC investors and the new groups of investors—retail money and hedge funds—created the result in 2020.
CURRENT STATE OF THE SPAC MARKET
With the record number and record amount of capital that has been raised in SPACs, the retail money chasing the pop in announcement phase is spread thinly across many deals.
Also, deals are priced even higher since there are many SPAC sponsors chasing the limited number of deals. This increases the likelihood that a deal is fully priced, or even over-priced.
Both factors above reduce the chance of a large pop during the announcement phase.
CONCLUSION
The trade to buy a SPAC at NAV and to sell during the pop in the announcement phase with attractive return is increasingly more difficult. Investors should not expect the same 2020 dynamics and outcome.
This SPAC wave in the U.S. has captured the attention of the global financial market. Different exchanges are also exploring ways to offer SPAC listings. Exchanges in Singapore, Hong Kong, and Japan are at various stages of getting their SPAC framework ready by 2021. Establishing guard rails for investors is no doubt on the top of the list of priorities for these exchanges.
Investors, on their part, need to understand that not all SPACs are created equal, and not all deals will work out. Performing their own due diligence and being educated about SPACs is still essential.
[1] Statistics from SPAC Analytics. Extracted on 10/05/2021 from: https://www.spacanalytics.com/
[2] Redemption actually tends to be much higher than 50% of capital raised. According to Klausner and Ohlrogge, mean and median redemptions for SPACs that merged between January 2019 and June 2020 were 58% and 73%, respectively.