By Hossein Kazemi, PhD, CFA, Isenberg School of Management and CAIA Association By the end of 2020, only 0.72% of all active US mutual funds had finished in the top quartile every year since 2016. Among mutual funds, mid-cap funds displayed the highest degree of persistence: 1.47% of them have finished in the top quartile for five consecutive years. The figures are equally disappointing in terms of absolute performance: only 7% of large-cap mutual funds have outperformed their benchmarks over the past 20 years on a volatility-adjusted basis. For mid-cap and small-cap funds, the figures are 14% and 12%, respectively.[1] Given the rise of passive equity investment products, these figures do not surprise most investors. How about hedge funds? Using the CISDM hedge fund database, I examined the relative volatility-adjusted annualized performances of hedge funds. Since 2010, only 4.8% of the hedge funds have been ranked in the top quartile more than half of the time. By the way, a 60/40 portfolio of equities/bonds would have been ranked in the top quartile 28% of the time. Exhibit 1 shows the percentage of hedge funds that displayed significant persistence between 2000 and 2017. Note that persistence here covers both consistent "winners" and "losers." For example, about 40% of funds consistently performed better or worse than their peers in the short run. As we move to 36 months in the future, the percentage of funds displaying persistence declines significantly. Only 15% of them displayed persistence after 36 months. More importantly, more than 60% of persistence cases are due to those funds that performed poorly. It turns out that it is easier to be consistently bad. In short, the sample of funds that consistently perform well is tiny. More importantly, persistence almost disappears after 36 months, which means that investors who want to take advantage of this property must be willing to turn over their hedge fund portfolio every 3-4 years. Another critical point to remember is that the degree of persistence among funds of funds is roughly the same as hedge funds. 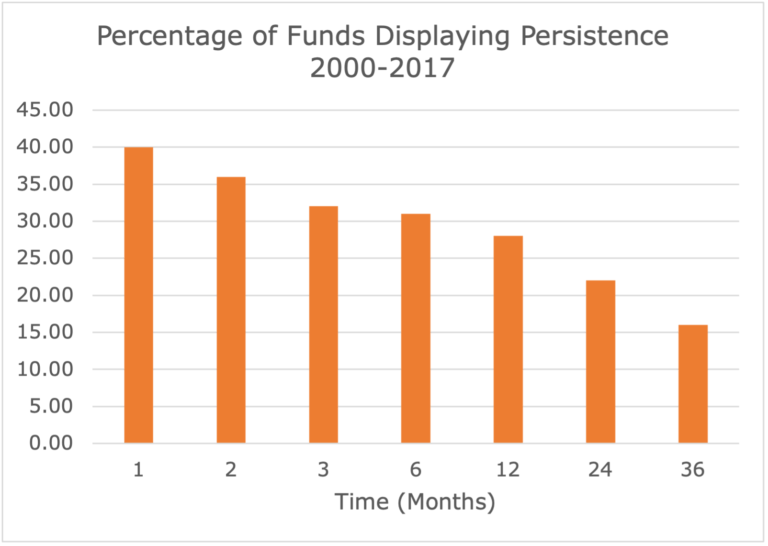 Exhibit 1: Percentage of hedge funds that display performance persistence (Source: CISDM) Using the CISDM database, I recreated Exhibit 1 for various strategies. The results are displayed in Exhibit 2. We can see that the degree of persistence varies by strategy, and a few of them display strong persistence and minimal drop-off at longer horizons. For example, about 40% of merger arbitrage managers display strong persistence for at least 36 months. The same applies to multi-strategy, where about 30% of funds display strong persistence. On the other hand, some strategies display strong performance only at short horizons. Other studies have shown that fund managers with a distinct approach to a given strategy are more likely to display persistence. For instance, a convertible arbitrage manager who employs a unique strategy implementation is more likely to display persistence – good or bad. How about private equity?
 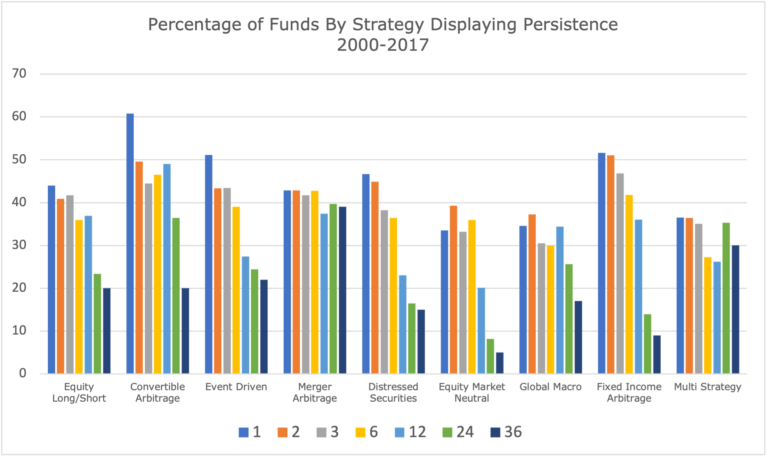 Exhibit 2: Percentage of Funds Displaying Persistence by Strategy (Source: CIDM) Measuring persistence in private equity (i.e., buyout and venture capital) is far more challenging. First, it is not very helpful to examine private equity funds' quarterly or annual performances because it is nearly impossible to have any turnover in a portfolio of private equity investments. Second, until a fund is almost entirely liquidated, the reported returns are highly unreliable and subject to significant smoothing. Finally, the presence of the J-curve creates predictable patterns in cash flows and returns, distorting any attempt to measure persistence in periodic returns. For these reasons, persistence is measured by comparing 5-7 year returns from different funds. Naturally, this approach significantly reduces the number of observations that each manager could potentially have. With this caveat in mind, we can report some of the recent findings on the performance persistence for private equity firms. Note that to avoid any biases related to interim reported returns, we must wait until a fund is liquidated to use the return realized by investors. This means that the most recent year that one can study is likely to be several years ago. First, consider the probability that a follow-on fund will be in the top quartile conditioned on the performance of the first fund. Exhibit 3 displays these conditional probabilities for buyout funds. We can see, for instance, the probability that the first follow-on buyout fund will be in the top quartile conditional on its previous being in the top quartile is about 37%. However, the probability that the second follow-on fund will end up in the top quartile is just above 20%. The apparent lesson is that investors should strongly consider investing in the first follow-on funds of successful buyout funds. However, second and third follow-on funds should stand on their own, and the historical performance of the GP is not a strong indicator of future performance.
 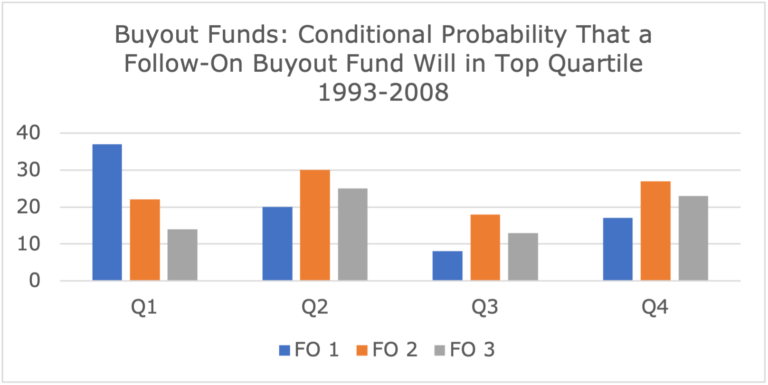 Exhibit 3: Conditional Probability for Follow-on Buyout Funds to Appear in the Top Quartile[2] The results for venture funds are presented in Exhibit 4. Unlike buyout, there appears to be significant persistence among VC funds. For top quartile funds, first, second, and even third follow-on funds have a good chance (30-35 percentage) of ending up in the top quartile. On the other hand, as far as VC funds are concerned, follow-on funds of the bottom half require extra care and due diligence.
 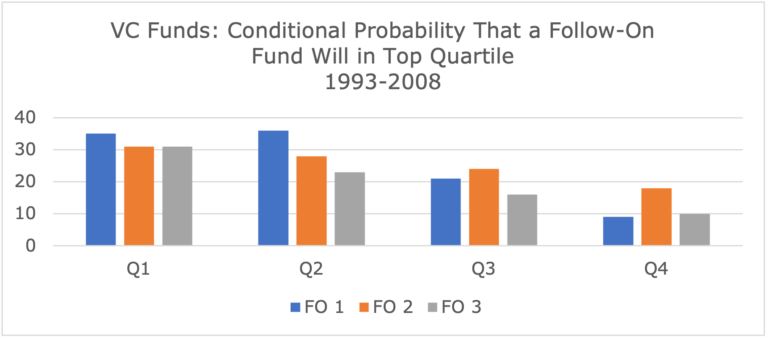 Exhibit 4: Conditional Probability for Follow-on VC Funds to Appear in the Top Quartile (Source: See Exhibit 3) The results make sense because of the presence of a virtuous circle in VC investing. Successfully exiting a venture-backed startup is a strong predictor that an entrepreneur's next startup will also generate attractive returns should she decide to go with the same VC fund. Consequently, top venture capitalists have an easier time attracting the most promising startups. There is another source of persistence for VC funds. An entrepreneur who has created a successful exit is more likely to create new startups with a similarly successful exit. In short, successful VC funds attract successful entrepreneurs, which only adds to the reputation of those VC funds. While there appears to be some performance persistence in VC funds, investors will have difficulty using that information to select the follow-on funds. The problem is that complete performance figures for the initial fund are not available when the follow-on fund is launched. Exhibit 5 displays the persistence results based on the information available when the follow-on fund is launched.
 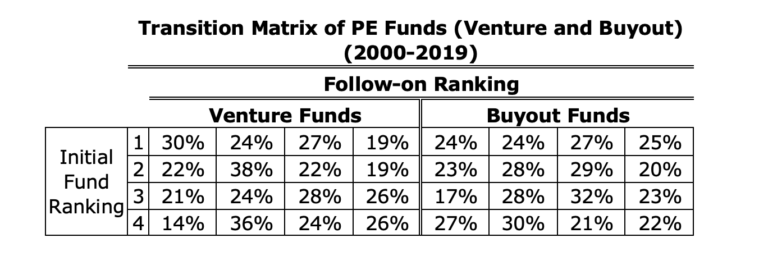 Exhibit 5: Transition Matrix of PE Funds for 2001-2019 (Source: Harris et al.[3]) The distribution of the follow-on funds of the top 3 quartiles is almost random for buyout funds (each cell has about 25% of the funds). However, the top 2 quartiles of VC funds are likely to have their follow-on funds to be ranked in those two quartiles. Can persistence results be exploited? Results regarding performance persistence are not clear cut. Suppose we were to start with the prior belief that markets are mostly efficient. Therefore, we expect the net-of-fees performances of active and alternative funds to be less than properly constructed passive benchmarks. In that case, the above results are not robust enough to change our minds. As important, even if there is some persistence, investors cannot take advantage of it. Almost all mutual funds impose restrictions on investors who want to turn over their mutual fund investments several times each year. Hedge funds have even more strict subscription and redemptions rules, and it will be nearly impossible to turn over a portfolio of hedge funds 3-4 times each year. Performance persistence among VC funds could be exploited, but only if the investor has access to top-tier funds to begin with. Further, the investor must be large enough to create a diversified portfolio of VC funds. So, it appears that the above academic/industry results are of limited value to asset allocators. Enter replication. While one may not be able to invest in top-tier funds to take advantage of performance persistence, one might be able to replicate their performances. Here, I will show some recent results that I have obtained in replicating top-tier managers' performances.[4] Can we replicate the best-of-breed managers? As we saw, using past performance as the only predictor of future performance leads to relatively weak persistence results. Consequently, I used a combination of risk, return, and other economic variables to identify the best-of-breed mutual and hedge funds. For private equity funds, I used several indices to identify the strategy (buyout or venture) that is likely to perform better in the short run. That is, at the beginning of each investment period, the funds or strategies that were likely to outperform were identified. To replicate these best-of-breed managers (strategies), one needs to have long enough data series to perform the calculations, but the history constantly changes as different funds (strategies) are recognized as best-of-breed through time. Once "stable" benchmarks of best-of-breed managers (strategies) are created, machine learning algorithms are employed to create replications. Exhibit 6 displays the replication results for mid-cap mutual funds. Daily data of a combination of passive ETFs and individual securities were used to replicate these best-of-breed mutual funds (the BoB Index).
  Exhibit 6: Replication of the best of breed mutual funds (Source: Author's Calculations) First, some will be surprised to see how well a strategy of investing in top-tier mid-cap funds performs. While the overall degree of performance persistence among mutual funds is low, a small percentage of them repeat their outperformance for a few weeks. The "momentum" strategy of investing in these funds could produce highly significant abnormal returns. Second, there needs to be some warning in using these results. For one, transaction and market impact costs are ignored. The strategy has relatively high turnover, which means those returns have to be adjusted down. Also, the results are likely to be time sensitive. Exhibit 7 displays the growth of $100 invested in the best-of-breed index, its replication, and a passive ETF representing mid-cap stocks.
 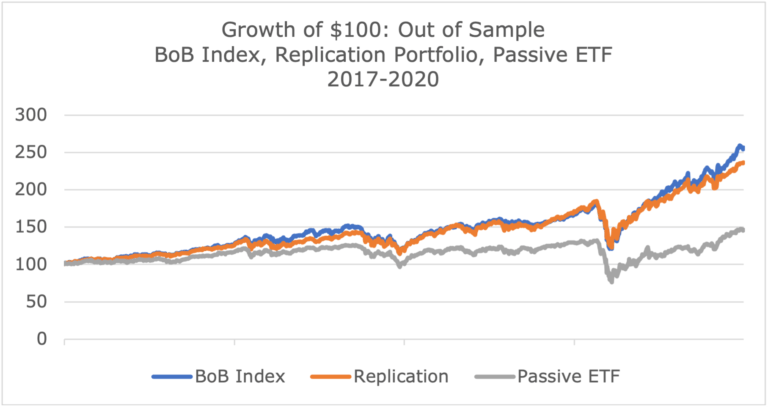 Exhibit 7: Growth of $100 invested in the best-of-breed index, its replication, and a passive ETF (Source: Author's calculations) I used the same approach to create and then replicate a best-of-breed index of hedge funds. In this case, I did not separate hedge funds by strategy and just "invested" in a small set of hedge funds that were predicted to outperform other hedge funds in the next few months. I used equity, fixed-income, and commodity ETFs to create the replication portfolios. The results appear in Exhibits 8 and 9.
  Exhibit 8: Replication of the best of breed hedge funds (Source: Author's Calculations)
 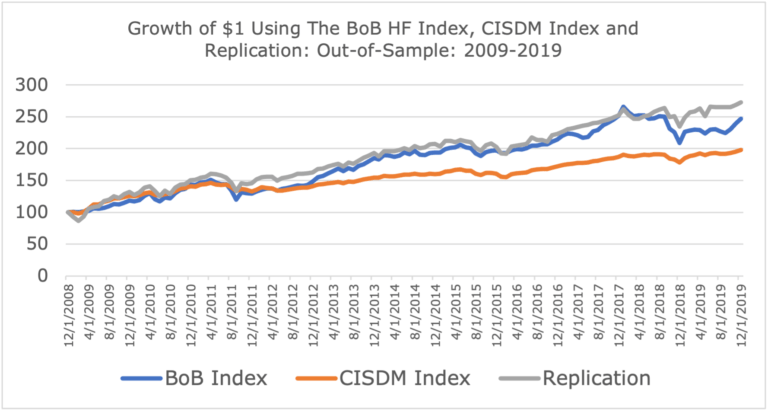 Exhibit 9: Growth of $100 invested in the best of breed hedge funds index, its replication and the CISDM Hedge Fund Index (Source: Author's calculations) Notice that the best-of-breed hedge fund index does not add as much outperformance as mutual funds. It is not apparent why that should be the case, especially given the previous results that hedge funds, on average, display stronger performance persistence than mutual funds. One possible explanation is that we have to wait an extra month before identifying the funds that are likely to outperform their peers. Hedge funds report their performance about 15-20 days from the end of each month. In other words, we are exploiting persistence after two months, which is much weaker than the daily persistence we exploited for mutual funds. Interestingly, the replicating portfolio outperforms the best-of-breed index by a small amount. Finally, we can turn to replicate the best-of-breed private equity funds. This posed several challenges that prevented me from creating a stable best-of-breed index of private equity funds. Instead, I created a best-strategy index that switched between buyout and venture capital strategies. This approach worked reasonably well using quarterly data reported by Cambridge Associates and Preqin. However, I chose to create the best-strategy index using Thomson Reuter's buyout and venture indices because the data is available at a higher frequency. The results appear in Exhibits 10 and 11.
  Exhibit 10: Performance of Dynamic Best Private Equity Strategies, its replication, and S&P 500 Index (Source: Author's Calculations)
 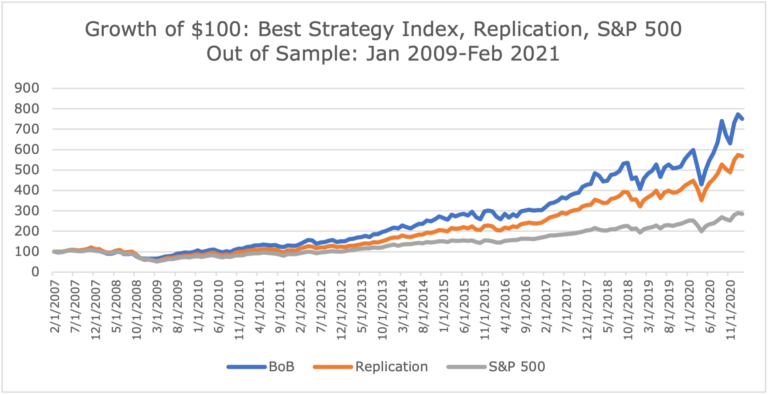 Exhibit 11: Growth of $100 Invested in Dynamic Best Strategy, its Replication and S&P 500 Index. The best-strategy index outperforms an equally weighted portfolio of buyout or venture strategies, indicating persistence and predictability in the performances of the two strategies. Given the short history of these indices and the nature of buyout and venture investments, the replication portfolio cannot match the best-strategy index's historical performance out of the sample. Still, both the index and the replication portfolio easily outperform S&P500 with slightly higher volatility. What are the lessons? Two lessons can be drawn from these results. First, past performance could be a useful indicator of future performance among specific private fund strategies. In hedge funds, the persistence becomes very weak as one looks at performance 3-4 years out. While past performance seems to be a good indicator of the potential relative performance of the first follow-on fund for private equity funds, the rankings of subsequent funds appear to be entirely random. In the case of hedge funds, we observe the most robust persistence among smaller and younger funds and those funds that are not strongly correlated with their peers. Also, hedge funds that have performed relatively well during periods of increased market stress tend to perform well when markets recover, and their outperformance appears to persist. It seems that funds with solid risk management and control systems are more likely to repeat as winners. Among private equity funds, larger funds tend to display stronger performance persistence when it comes to their first follow-on funds. The advantage disappears with subsequent funds. Also, among private equity funds, venture funds display the strongest persistence. Given the illiquidity of these asset classes along with the significant time lag in releasing their performance figures, the value of past performance in selecting managers is marginal at best. It is critical to note that all persistence results reported in academic and industry papers apply to funds portfolios. Persistence at the individual fund level is even weaker and highly unpredictable. Therefore, one has to invest in large diversified portfolios of these private funds to take advantage of any persistence. The second lesson is that one could invest indirectly in these best-of-breed managers and strategies by using a replication approach. The replication portfolio will be highly diversified and liquid. Creating the indices and the replication algorithms will take time and effort, but the value-added could be significant. Hiring an investment professional who has completed her FDP charter will help! References [1] See https://www.spglobal.com/spdji/en/research-insights/spiva/ [2] https://www.preqin.com/. Kaplan, Steven Neil and Sensoy, Berk A., Private Equity Performance: A Survey (October 15, 2014). Charles A. Dice Center Working Paper No. 2015-10 , Fisher College of Business Working Paper No. 2015-03-10, Available at SSRN: https://ssrn.com/abstract=2627312. Chung, Ji-Woong, Performance Persistence in Private Equity Funds (March 1, 2012). Available at SSRN: https://ssrn.com/abstract=1686112. Braun, Reiner and Jenkinson, Tim and Stoff, Ingo, How Persistent is Private Equity Performance? Evidence from Deal-Level Data (December 21, 2015). Available at SSRN: https://ssrn.com/abstract=2314400. Kaplan, Steven Neil and Sensoy, Berk A., Private Equity Performance: A Survey (October 15, 2014). Charles A. Dice Center Working Paper No. 2015-10 , Fisher College of Business Working Paper No. 2015-03-10, Available at SSRN: https://ssrn.com/abstract=2627312 [3] Harris, Robert S. and Jenkinson, Tim and Kaplan, Steven Neil and Stucke, Rüdiger, Has Persistence Persisted in Private Equity? Evidence from Buyout and Venture Capital Funds (November 9, 2020), Available at SSRN: https://ssrn.com/abstract=2304808 [4] A combination of GARCH and LASSO/LARS were used to obtain the estimates. To overcome the small sample size, bootstrap and simulation methods were used as well.

←
Back to Portfolio for the Future™
Performance Persistence: Is It There, and Can It Be Exploited?
June 3, 2021


