
By Roberto Croce, Head of Risk Parity and Alternative Risk Premia, Newton Investment Management North America LLC.
Risk premia are market neutral factor portfolios, where factors are quantifiable characteristics of securities that have historically been related to subsequent return. Top academic journals published papers documenting many hundreds of purportedly distinct factors.[i] If there really were so many market neutral factors with attractive risk-adjusted return, then it would be nearly impossible for a well-diversified basket of these investments to lose money over time. But in reality, many risk premia strategies did very poorly 2018 – 2020, in up and down markets alike. As a result, some investors and pundits began dismissing risk premia as another misguided investment fad. What happened? The purpose of this paper is to discuss what happened in general and then to propose a very specific solution. We believe prioritizing more factors over finding a smaller set of factors with much higher statistical confidence and the ability to inform the full range of investment decisions is where strategies went wrong, and doing the opposite of this is the solution.
High conviction factors are security characteristics that predict not only cross sectional relative return (for security selection, as in most alternative risk premia strategies), but also cross asset relative attractiveness and time series absolute attractiveness. Unlike a portfolio of alternative risk premia, a high conviction factor portfolio can exploit the full set of investment decisions: Do I want to take risk and if so, how much? Where do I want to take risk? What securities within a sector are the most attractive sources of risk, and which are the least attractive? Robust portfolios of high conviction factors have the ability to thrive even in environments where security selection alone struggles.
So what happened?
First, as an industry, we went to great lengths to populate every intersection between asset classes and factor names like “carry, value, momentum, defensive, volatility, and trend.” This effort led to data mining of every conceivable definition of each descriptor until historical results demonstrated statistical significance at classical levels of confidence. Many of us defined statistical significance without accounting for multiple testing bias, increasing the likelihood of false positives to well over 50%. The result was a matrix of over fitted factors where each had a better than even chance of being false. When viewed in this light, the failure rate of some alternative risk premia strategies is less surprising. Please see the paper cited below for a full treatment of this issue.
Second, the typical academic approach of sorting similar securities does little to measure the full economic potential of a factor to drive portfolio returns. A factor’s potential comes from its ability to forecast future relative and absolute levels of return within and across asset classes, which is a much broader mandate than simply predicting relative return within a single asset class. Rather than using a few high conviction factors to inform the full range of investment decisions, most risk premia strategies instead sought to generate performance by diversifying across a larger number of factor/asset class pairs. The problem with this approach is that in many cases, factors were defined differently in different asset classes, so that the factors were not effective at making cross-asset class decisions. As a result, most of the most prominent managers in this space concluding that timing risk premia was a losing proposition. What if the reason it didn’t work is that some of those factors were false?
Our solution to the problem of not being able to time factors is to focus on a subset of the factor universe where the measure of attractiveness is defined similarly across all included asset classes. This refinement allows us to use factors to ferret out the most attractive asset classes and times in which to deploy risk and should lead to much better performance.
To illustrate the difference, we decompose the historical simulated return of our high conviction factor strategy into 3 independent components:
- Average directional exposure to each asset class, which would typically be thought of as the strategic allocation but in this case is 100% due to average historical relative attractiveness, so it is informed rather than structurally pre-defined
- Tactical allocation, or the dynamic repositioning across the asset class exposures as factors indicate shifting relative opportunity, and
Security selection, or returns in each asset class driven by differences between the actual relative weights within the asset class and the weights in an equally volatility weighted portfolio.
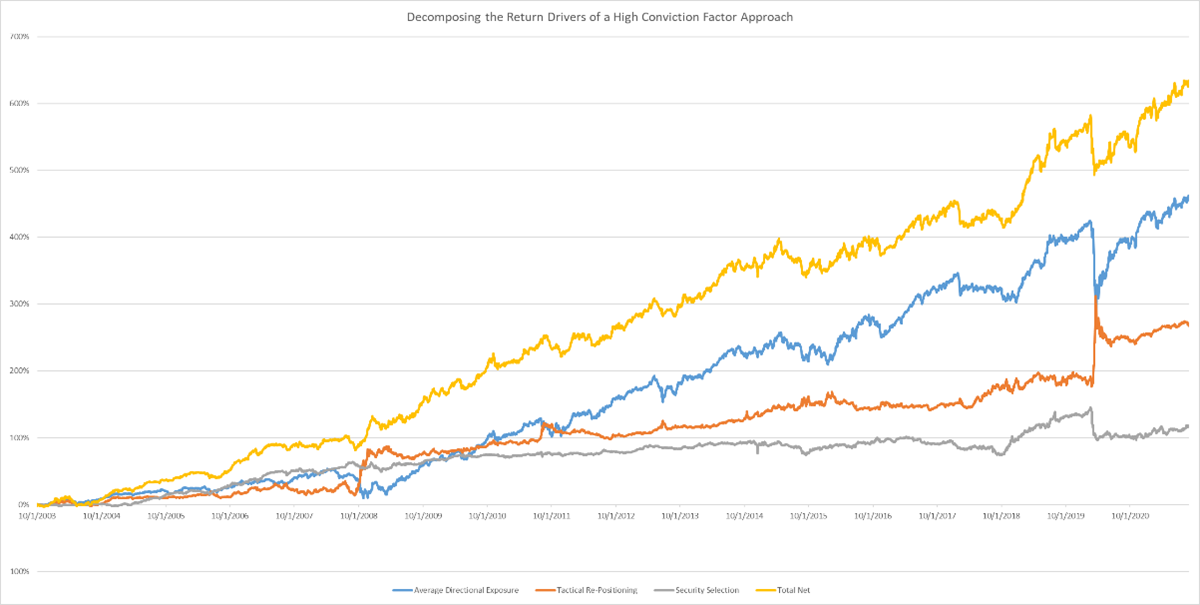
What stands out immediately is that security selection alone, at least in this multi-asset universe, is the smallest contributor to total return. Tactical allocation across asset classes is more important to total return in this framework. The largest historical contribution came from the average position, which is informed by the high conviction factor scores. There is no strategic allocation underlying the historical average positioning—it is purely a function of the high conviction factor scores. Not surprisingly, these averages include negative weights on volatility futures, positive weights on emerging market currencies, and positive weights on credit spreads and interest rate futures, meaning they are a combination of traditional and alternative beta exposures.
A second important take away from the figure is that security selection and the average historical exposure can both lose value at the same time—the security selection decisions are not always diversifying in the way we would like them to be. But the asset class decision seems to help during some of the periods that were very challenging for the average directional exposure and security selection decisions. Certainly the combination of all three sets of decisions offers a significantly more resilient return stream. Statistically, where does this come from?
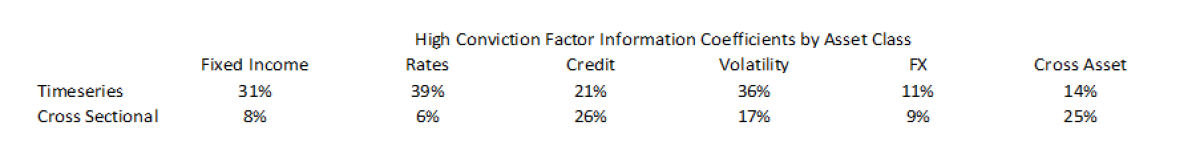
The table below shows the information coefficients, or the correlation between factor scores and subsequent market returns, in each asset class. A rule of thumb is that an information coefficient of 0.05, or 5%, is good and 0.10 is excellent. In the table, the timeseries decision measures the correlation between factor scores today and market returns in the asset class over the coming month (with no overlap), while the cross sectional decision measures the average historical correlation between factor scores and the relative performance of securities within the asset class (all securities are re-risked to the same ex ante volatility before measurement). What stands out is that, within most of the asset classes, time series predictive power is much higher than cross sectional power. That should not be super surprising given that a major driver of this is yield. It’s like saying that yield predicts future return—duh. What is powerful is that we can measure yield across a broader set of assets than usual and do it in a uniform way, which will allow us to use the yield measure to time asset class exposures and select from markets within each class.
The high timeseries scores mean that decisions about when to invest in the asset class, whether directionally or cross sectionally, are better informed than the security selection decisions within the same asset class.
The “Cross Asset” decision measures the power of the high conviction factors to tell us when risk taking in general is attractive (timeseries) and where risk should be taken across the asset classes (cross sectional). The cross sectional cross asset decision looks at the relative attractiveness of the optimal portfolios in each asset class, and an IC of 0.25 indicates strong ability to predict which asset class portfolio will outperform. The lower cross asset timeseries score indicates that, once we have the optimal mix of asset class portfolios, we have about a 14% ability to predict future absolute returns, which is quite good.
As we were developing this strategy, a concern with the approach was that it could lead to substantial directional exposure when factor scores were alined with risk assets. When we look at the average historical exposures, they look directional. The decomposition of where the approach deployed risk historically, it was as follows:
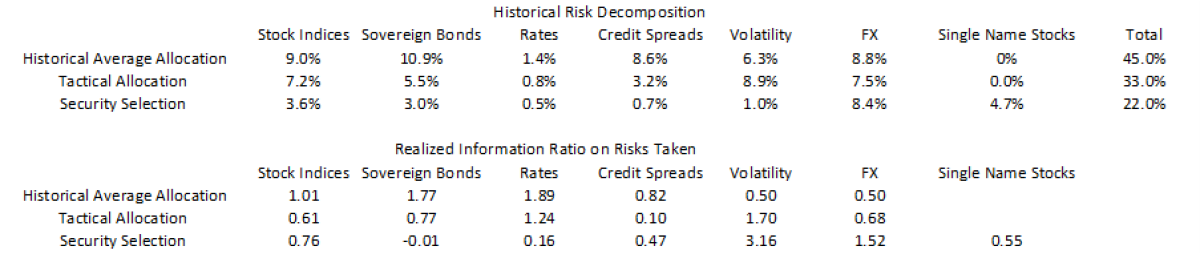
The table says that the strategy deployed 45% of its risk in directional positions on average historically, whereas 33% of its risk was taken tactically shifting around these historical averages. The remainder of risk, or 22%, was taken in security selection decisions. This relative split was determined entirely by the relative attractiveness measures. If the factor scores had been totally static, then all the risk would have been deployed in the first row. If the factor scores had been such that each was centred around zero, then the average allocation would have contributed zero risk and the dynamic decisions, tactical allocation and security selection, would have contributed all the risk. Instead, a holistic, high conviction factor-driven led to a balanced mix of all three.
The middle row of the lower section of the table tells us the realized information ratio, or active return divided by risk, that the strategy captured with asset class timing decisions. If the conventional wisdom that you can’t time factors was applicable to the set of factors included here, these IRs would be zero, or at least have a mean of zero. Instead, they are materially positive; high conviction factors lend themselves to asset class timing decisions.
Conclusion
We believe that factors, or “risk premia” are a powerful mechanism for predicting returns and building diversifying strategies. The features that drew investors to the product category—scalability, diversification, transparency—are still available. As an industry, we took too much comfort in defining many factors which, if they were all genuinely predictive, would have made it virtually impossible to lose money. Alas, datamining is an issue in any non-experimental science and it likely contributed materially to the challenges faced by factor strategies.
We propose a simple solution: focus on high conviction factors that are measured and interpreted identically across asset classes, where the performance has persisted for decades after first publication and where the factors predict not only cross sectional within-asset decisions, but also directional and asset class decisions. More investment decisions using fewer, likely better factors.
[i] A good starting point for those who wish to understand this in more detail is Campbell Harvey and Yan Liu’s paper, “ A Census of the Factor Zoo,” available here: https://papers.ssrn.com/sol3/papers.cfm?abstract_id=3341728.
About the Author:
Roberto Croce Ph.D. is a Senior Portfolio Manager and Head of Liquid Alternatives at Newton Investment Management in Boston. In this role, Roberto and his team manage Newton's risk parity and risk premia offerings and design new strategies to solve clients' most pressing investment problems.
Prior to joining Newton in 2018, Roberto was the Head of Quantitative Strategies at Salient Partners in Houston. Rob joined Salient in 2011 as a quantitative analyst, early in Salient's transformation from a fund-of-funds manager into a direct manager of client assets. He led the build-out of quantitative infrastructure at Salient, eventually rising to Managing Director and Partner, as he managed a team of computer scientists, software engineers, and data scientists. The result was a fully automated investment process with a focus on empirical measurement and constant improvement of every facet of the investment process.
Prior to joining Salient Partners in 2011, Roberto spent six years at the Ohio State University teaching macroeconomics and econometrics. While at Ohio State, Rob spent a summer working on the Quantitative Research team at the Teachers Retirement System of Texas, where he had exposure to the application of financial theory to real-world institutional investing, with a particular focus on risk parity strategies.
Roberto has Ph.D. and MA degrees in economics from the Ohio State University and a BS in Business Economics from Penn State.