


By Stephen L. Nesbitt – Chief Executive Officer, Chief Investment Officer of Cliffwater.
Economic alarms can be heard in the distance that are reminiscent of the 1970’s period of high inflation, a stagnant U.S. economy, and single-term presidencies. A reminder of the deleterious effect of this period on capital formation is presented, followed by an asset allocation for today’s investors seeking shelter from a similar economic storm.
Lessons Learned from the U.S. Stagflation Experience: 1973-82
What didn’t work:
- A stagnant 1.5% real GDP growth (encompassing three recessions), equal to one-third of the 4%+ annual GDP rate of the prior two decades, and one-half the 3%+ annual GDP rate of the subsequent two decades
- An 8. 7% CPI inflation rate, equal to almost 4x the 2.4% inflation rate of the prior two decades and almost 3x the 3.1% inflation rate of the subsequent two decades.
- High average interest rates, equal to 9.7% and 9.4%, respectively, for 10-year Treasuries and Fed Funds, trailing inflation for most of the time period until Paul Volker propelled double digit rates in 1981 and 1982, suppressing inflation but also putting the economy into severe recession.
- Stock values were massacred by a 26% drop in real earnings and a 39% drop in price-earnings ratio from 18x to 11x, leaving a negative 2% annualized real return during the stagflation time period.
- An equivalent beating for fixed rate bonds, as the climb in 10-year Treasury rates from 6% to 13% caused a negative 3% annualized real return.
- Commodities falling a cumulative 40% over the period, succumbing to the sluggish economy.
What worked:
- Real estate, measured by REIT performance, earned a 13.2% nominal annual return and netting a 4.5% real return. During the stagflation period REITs earnings grew at over a 5% annual rate, passing through over 50% of inflation through to rental income.
- TIPS earned a 11.7% nominal return1, supported by their CPI-floating coupon and principal, and netting a 3.0% real return.
- Cash earned a 0% annualized real return, protecting value but no more.
- Credit, apart from interest rate duration, was largely unaffected, perhaps because inflation deflates debt obligations. Non-investment grade defaults averaged 1.7% for the 1973-82 period compared to the 2.8% average default rate for the last century.2 However, default rates picked up significantly after the stagflation period as real rates reached historical highs in the mid-1980’s.
- Gold prices swung wildly during the period but managed to produce an impressive 9.2% real return.
- The US dollar was mixed, gaining 35-40% against weaker U.K. and French economies, but losing 20-45% against the fiscally stronger German, Swiss, and Japanese economies.
Inflation Protected Asset Allocation
Predicting economic cycles, business cycles, market cycles, and the like is nearly impossible. To our knowledge, no firm has been successful at doing so. Mostly, investors only recognize a cycle when they are already in it, and by then it is too late to do much about it. Instead, our advice has been to construct portfolios that can weather cycles, through smart diversification and selecting managers that have a history of making good decisions on the ground. Instead of mastering the market cycle, we prefer to manage through it.
Stagflation, like deflation, is less a cycle and more a regime change with longevity. Predicting its onset is also nearly impossible but perhaps investment adaptation once the regime materializes can be worthwhile. “Inflation betas”, like stock betas, are metrics we have been calculating for many years and measure the performance sensitivity of asset classes to changes in unexpected inflation.3 The chart below shows what an asset allocation might look like that exhibits a high inflation beta equal to 1.14, together with the expectation of high risk-adjusted return. A 1.14 inflation beta means that, all else equal, if inflation unexpectedly increases by 1.00%, the portfolio return should increase by 1.14%. If, and when, a stagflation regime makes itself apparent, this differentiated asset allocation might assist investors to better weather a multi-year stagflation scenario.
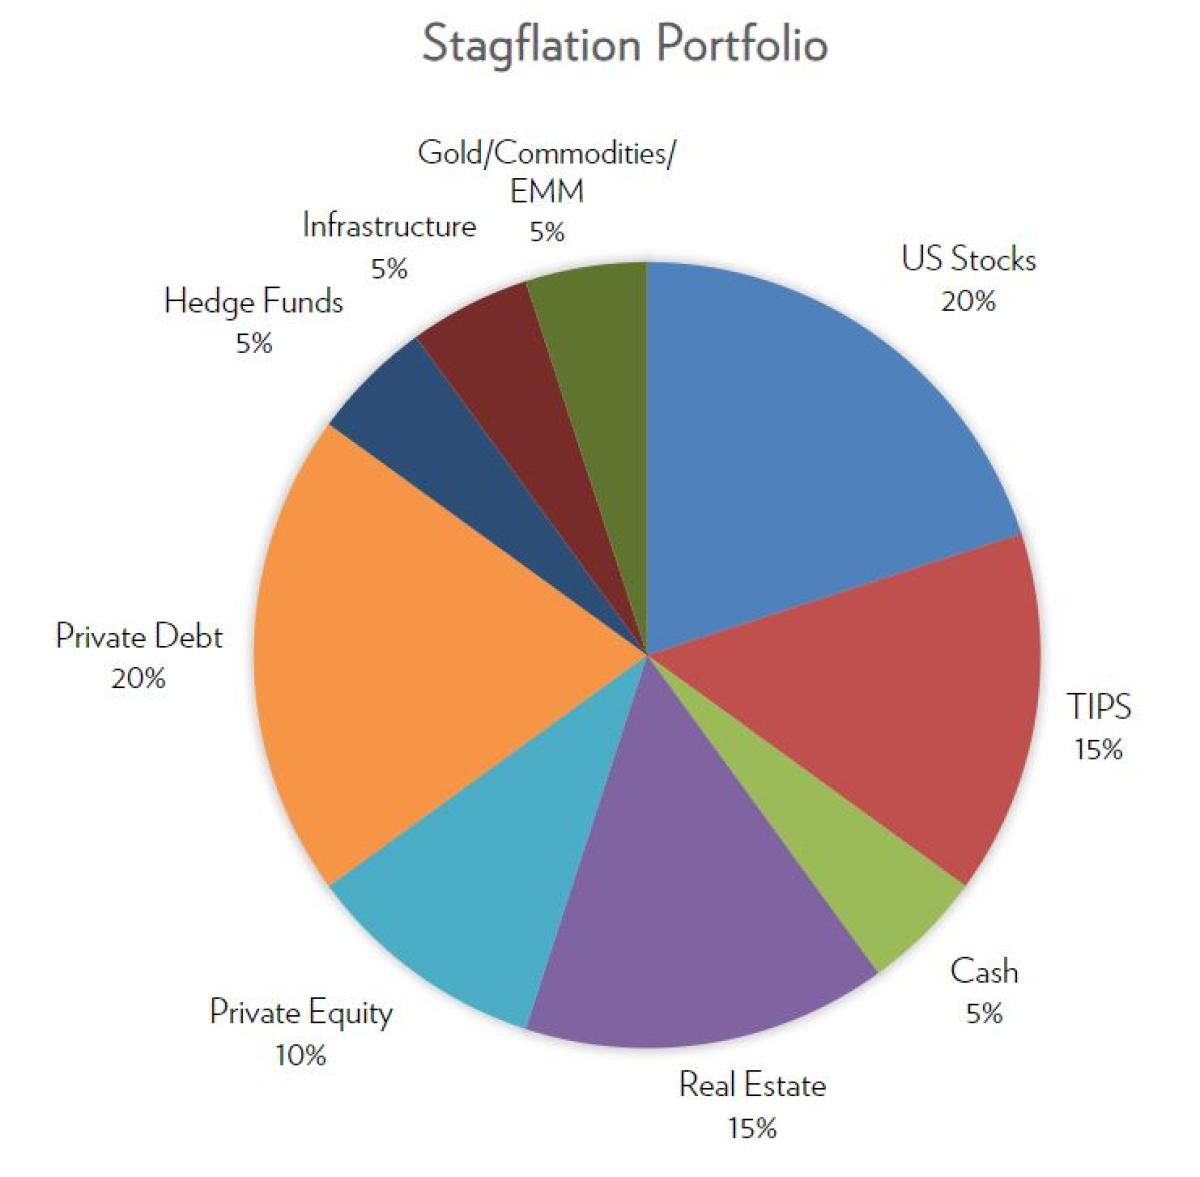
The portfolio tilts toward stagflation protection, recognizing that such a regime is not a certainty but a strong likelihood. Consequently, stocks and private equity are included despite their negative inflation betas. The 5% allocation to gold, commodities, and emerging markets represents a blend of asset classes that have positive inflation sensitivity but can be very volatile. The allocation to emerging markets has been kept small because it did not exist as a measurable asset class during the stagflation period examined. Investors with stronger conviction in this last commodity and emerging market asset class might expand upon the 5% allocation, reducing equities or infrastructure.
Conclusion
We are able to discriminate the inflation sensitivity of asset classes through statistical analysis of historical returns during the stagflation period of the 1970’s and construct a portfolio that weathers a repeat scenario better than traditional portfolios. Even though we have no crystal ball to predict stagflation’s reoccurrence, and argue no one else does either, we believe that portfolio changes can be useful at the onset of stagflation due to its likely longevity.
Footnotes:
1 TIPS did not exist until 1997. The TIPS return cited is based upon back-tested returns using actual 10-year Treasury yields and CPI inflation for the 1973-1982 period together with Cliffwater modeling of TIPs returns for the same period. The 11.7% annualized modeled TIP S return is consistent with Bridgewater’s 12.8% modeling for the same time period.
2 Moody’s 2021 Annual Default Study.
3 Expected inflation betas by asset class are US Stocks (-0.77), TIPS (2.55), Cash (0.64), Real Estate (2.76), Private Equity (-0.91), Private Debt (0.91), Hedge Funds (1.00), Infrastructure (1.09), Gold (3.37), Commodities (2.86), Emerging Markets (4.73).
Stagflation Portfolio: US Stocks 20% TIPS 15% Cash 5% Real Estate 15% Private Equity 10% Private Debt 20% Hedge Funds 5% Infrastructure 5% Gold/Commodities/EMM 5%.
About the Author:
Steve Nesbitt is Chief Executive Officer and oversees all investment research as the firm’s Chief Investment Officer. Prior to forming Cliffwater in 2004, Steve was a Senior Managing Director at Wilshire Associates. From 1990 to 2004, Steve led the Consulting division at Wilshire Associates and also started and built its asset management business using a 'manager of managers' investment approach, including private equity and hedge fund-of-fund portfolios. Steve started his career at Wells Fargo Investment Advisors, an early pioneer in index funds, where he developed and managed index funds and oversaw asset allocation.

He graduated summa cum laude, with a BA in Mathematics and Economics from Eisenhower College (Rochester Institute of Technology), and an MBA, with Distinction, from The Wharton School at The University of Pennsylvania.