


By Stephen L. Nesbitt – Chief Executive Officer, Chief Investment Officer of Cliffwater.
Historical risk for private assets measures below equivalent public assets.1 For example, the standard deviation for private equity over the last 10 years equals 10.1% compared to 6.2% for the Russell 3000 stock index.2 Similarly, the standard deviation for private debt equals 2.9% over the last 10 years compared to 6.5% for the Morningstar LSTA US Leveraged Loan Index. These measurements are inconvenient for allocators who expect return and risk to be correlated. Explanations generally are directed at private asset prices, accusing valuation agents of understating price changes.3
We clarify below how public and private assets are different and why private assets should have less volatility compared to public assets. On the other hand, private assets are illiquid and lack the optionality public asset investors enjoy to freely exchange holdings for cash.
We conclude with test results for private asset valuation integrity and find that investors can have confidence in the values reported, except for real estate. These findings are important as private alternatives increasingly make their way into semi-liquid vehicles distributed through wealth management channels, where the investors rely on net asset value.
Why are risk (volatility) measures generally lower for private asset classes compared to equivalent public asset classes?
A liquidity factor is uniquely present in public securities and gives investors the ability to exchange their asset exposure for cash at any time. The liquidity option is potentially very valuable to investors for many reasons.4 Consequently, investors with assets that come with the liquidity option (e.g., publics) are willing to pay a higher price and consequently accept a lower yield/return. It also appears that the value of this liquidity option is time-varying, correlated with market uncertainty, and the circumstances of investors that happen to be those marginal price-setters where all trades are cleared. This liquidity factor has a high expected cost and is volatile in periods of market stress. Comparing publics with privates will result in publics having a lower return and higher volatility of return as a by-product of this liquidity factor.
How does the liquidity factor work in practice? Can you provide an example?
Pricing for publics is set by the marginal investor whose bid will clear all supply and demand at any moment. This price may or may not reflect fundamentals. For example, the leveraged loan market is driven by the CLO market and deleveraging in 2008 caused the demand for liquidity to shoot sky high and leveraged loan pricing to sink. Private loans, absent the liquidity factor, were divorced from the CLO market, with a different type of hold-to-maturity marginal investor setting the price, unlike that desperate leveraged loan marginal investor. Logically, two different prices for two roughly similar loans, one with and one without the liquidity factor, is very reasonable.
Ok, public-private pricing and volatility should be different, but can I trust private asset valuations?
The public exchange clearing mechanism makes valuation convenient and comforting to price-takers if they believe the market is efficient. Unfortunately, pricing private assets is not so elegant. There are many capable valuation firms following multiple methods (but primarily three) that recommend private asset pricing, sans the liquidity factor. The fact that the periodic volatility of their valuations is less than the public equivalent should not be surprising. In fact, it should be far less, as historical data shows.
A potential problem in private asset price discovery is “anchoring” where valuation agents implicitly lean toward past values when formulating current value. Logically, anchoring should not be present in valuations since price changes should only reflect new information and not old information. The easiest way to identify the presence of anchoring is the serial correlation statistic that calculates the correlation between periodic returns and the same returns but lagged one or more periods. Unlike the liquidity factor that understandably contributes to lower private asset volatility, anchoring results in risk being underestimated. The good news,
shown below, is that anchoring is only a serious concern with real estate.
Our findings are these:
- Private Debt. Across private assets, confidence should be high in private debt valuations. Serial correlation is statistically significant for a one quarter lag only with an 8% R-squared, meaning that the prior quarter’s return explains a very low 8% of the current quarter’s return.
- Private Infrastructure. Our findings are like private debt with a statistically significant one quarter lag only and a 7% R-squared.
- Private Equity. Like private debt and infrastructure, statistically significant serial correlation is limited to a one quarter lag but with a higher, but still low, 13% R-squared.
- Real Estate. Here is where a material problem exists. Statistically significant serial correlations exist over the three immediate prior quarters with a 75% R-squared, meaning that (a) 75% of the valuation change in the most current quarter is explained by what happened in the prior three quarters and (b) information a year old is influencing current real estate valuations.
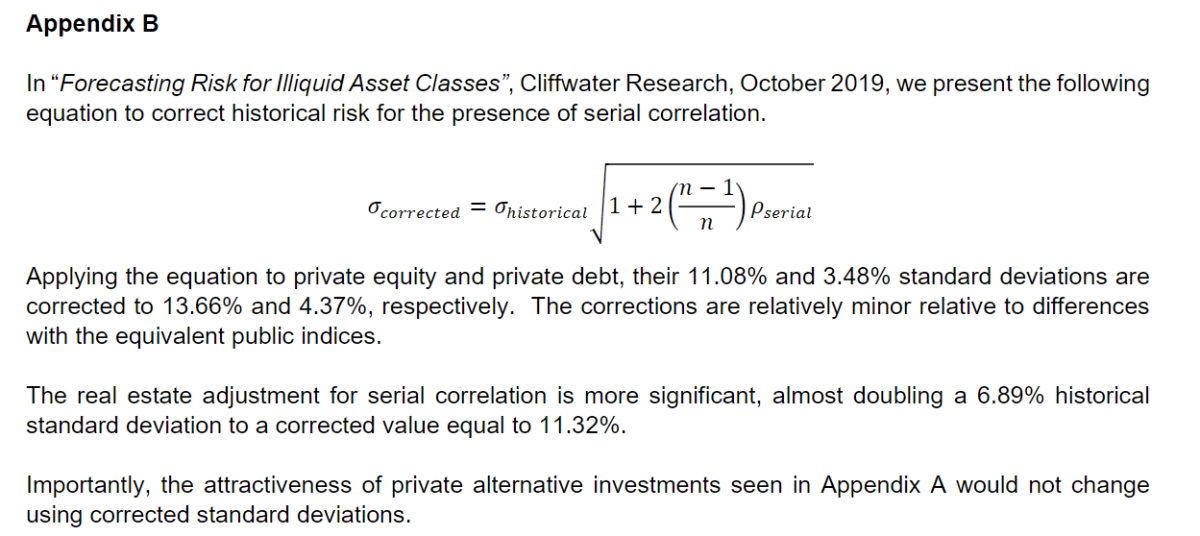
The good news is that once serial correlations are estimated, historically measured standard deviations can be adjusted (upward) mathematically to correct for its presence. Except for real estate, these adjustments are minor.5
How do these findings impact asset allocation?
Allocators should rely more upon historical risk, with some adjustments, when forecasting future private asset risk rather than substituting risk levels for equivalent public asset classes. This will give investors a more accurate understanding of short-term volatility in their portfolios. Regarding asset allocation, private assets should be penalized for their illiquidity, either directly through portfolio constraints or indirectly by placing an illiquidity tax on their expected returns.
Appendix A
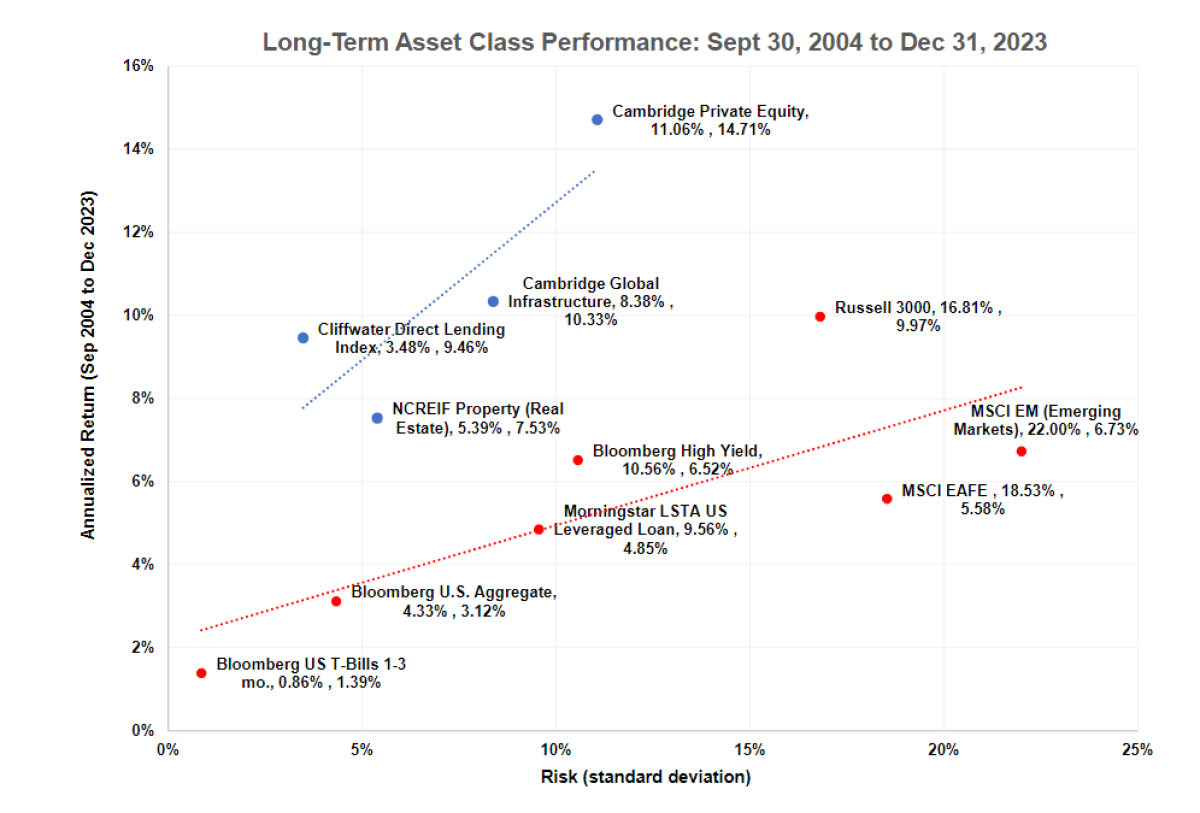
The graph below is reprinted from “Private Assets Outperform”, Cliffwater Research, April 19, 2024, and is provided to illustrate the contrast between the lower risk (standard deviation) found private debt (Cliffwater Direct Lending Index) and private equity (Cambridge Private Equity) compared to higher risk levels for public credit (Morningstar LSTA US Leveraged Loan Index) and public equity (Russell 3000 Index). For example, the historical standard deviation for private equity measures 11.06% compared to 16.81% for the public stocks. Our thesis is that the higher risk found in public stocks is largely attributable to a significant and volatile liquidity factor attached to stocks but not private equity. A similar relationship exists between the lower 3.48% standard deviation for private debt compared to 9.68% for public non-investment grade debt.
Footnotes:
1 See Cliffwater Research, “Private Assets Outperform”, April 19, 2024, and Appendix A.
2 Private equity and private debt are represented by the Cambridge Private Equity Index and the Cliffwater Direct
Lending Index, respectively.
3 For example, some public asset managers have promoted a narrative they call “volatility laundering” to suggest sinister
motives in private asset valuation.
4 Benefits of liquidity include portfolio rebalancing, loss mitigation, active management, change in cash needs, tax
management, asset/liability management, and limiting uncertainty.
5 See Cliffwater Research, “Forecasting Risk for Illiquid Asset Classes”, October 2019, and Appendix B.
All posts are the opinion of the contributing author. As such, they should not be construed as investment advice, nor do the opinions expressed necessarily reflect the views of CAIA Association or the author’s employer.
About the Author:
Steve Nesbitt is the Chief Executive Officer and Chief Investment Officer of Cliffwater, and is primarily responsible for the day-to-day management of Cliffwater Corporate Lending Fund (CCLFX) and the Cliffwater Enhanced Lending Fund (CELFX), an SEC registered credit interval fund focused on the US corporate middle market.

Steve is recognized for a broad range of investment research. His papers have appeared in the Financial Analysts Journal, The Journal of Portfolio Management, The Journal of Applied Corporate Finance, and The Journal of Alternative Investments. His private debt research led to the creation of the Cliffwater BDC Index, measuring historical BDC performance, and the Cliffwater Direct Lending Index, measuring historical performance for direct middle market loans. Steve authored the book, Private Debt: Opportunities in Corporate Direct Lending, Wiley Finance (2019) which provides the analytical and empirical underpinnings of the private debt market.
Stephen L. Nesbitt snesbitt@cliffwater.com
The views expressed herein are the views of Cliffwater LLC (“Cliffwater”) only through the date of this report and are subject to change based on market or other conditions. All information has been obtained from sources believed to be reliable, but its accuracy is not guaranteed. Cliffwater has not conducted an independent verification of the information. The information herein may include inaccuracies or typographical errors. Due to various factors, including the inherent possibility of human or mechanical error, the accuracy, completeness, timeliness and correct sequencing of such information and the results obtained from its use are not guaranteed by Cliffwater. No representation, warranty, or undertaking, express or implied, is given as to the accuracy or completeness of the information or opinions contained in this report. This report is not an advertisement, is being distributed for informational purposes only and should not be considered investment advice, nor shall it be construed as an offer or solicitation of an offer for the purchase or sale of any security. The information we provide does not take into account any investor’s particular investment objectives, strategies, tax status or investment horizon. Cliffwater shall not be responsible for investment decisions, damages, or other losses resulting from the use of the information. Past performance does not guarantee future performance. Future returns are not guaranteed, and a loss of principal may occur. Statements that are nonfactual in nature, including opinions, projections, and estimates, assume certain economic conditions and industry developments and constitute only current opinions that are subject to change without notice. Cliffwater is a service mark of Cliffwater LLC.