
|
By Daniel Fang, CFA, CAIA, Senior Quantitative Research Analyst, Jim Johnson, CFA, Senior Quantitative Strategist and Rob Lehnherr, CFA, Head of Quantitative Equity Research at Northern Trust.
Style Factors have done well as prices have soared, but peak inflation may not signal the end of the factor trade. Inflation continues to reach levels not seen in over 40 years. The latest release[1] of the US Consumer Price Index (CPI) reported a 9.1% increase over the last 12 months before seasonal adjustment. Despite the recent trend, aggressive monetary tightening and cooling energy prices have led many to call for a near-term inflation reversal. The implications of declining prices are now on the minds of investors, particularly for value and defensive strategies which have performed well as inflation has surged.[2]Our analysis shows that a reversal in prices does not imply weaker factor performance but does indicate increased factor dispersion. We believe a balanced factor portfolio will position investors well for a transitioning inflation regime. While the Russian-Ukrainian conflict and recurring COVID lockdowns have been commonly cited inflation catalysts, Exhibit 1 shows these recent supply shocks fueled an already burning fire. Inflationary pressures have built steadily over the past two years, as the US CPI increased from 0% to 9% on a year-over-year basis in an almost linear manner. This gradual increase provided investors an opportunity to reposition their portfolio, with tilts towards value (dividend yield), low volatility, and quality commonly employed. 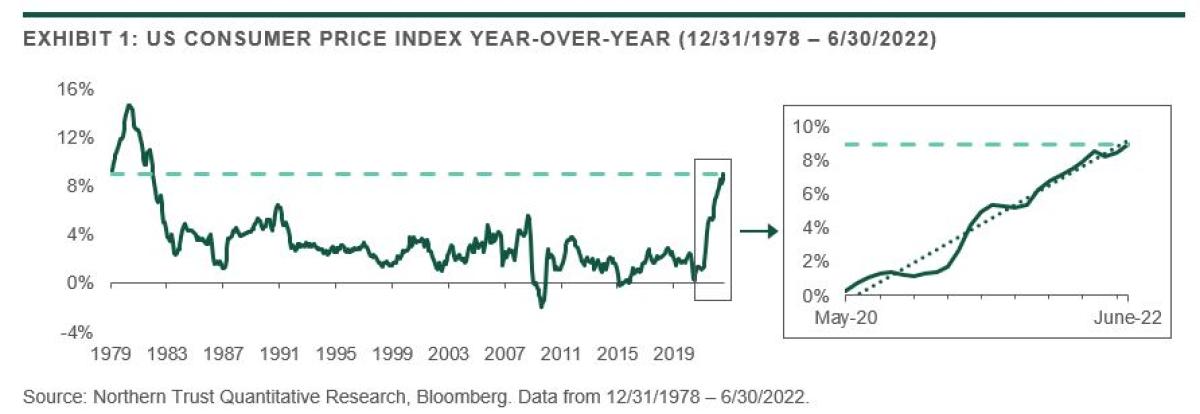
While these tactical calls have likely paid off, investors have begun to consider whether these trades have run their course as central banks become increasingly aggressive in their attempts to combat inflation. There are two main questions on investors’ minds, 1) If inflation is about to reverse, is now the time to reallocate? and 2) If so, to what extent does a hard or soft-landing influence this decision? In this research note, we address these questions by evaluating the impact of reaching peak inflation in previous inflationary episodes.
Inflation analysis framework In order to evaluate the effects of inflation on factor performance we first need a framework to classify regimes, with the goal of identifying inflationary episodes that are material to the economy. Solely identifying periods of rising inflation is not sufficient from our perspective, as inflation needs to be both elevated and sustained in order to have an economic impact. Separating the trend from the data is another important aspect, as we believe the speed with which economic participants react (companies, consumers, policymakers, etc.) is more accurately captured by the trend than the underlying timeseries – which is inherently noisy. With these considerations in mind, we apply an HP filter[3],[4] to the US Consumer Price Index, and define our regimes such that the inflation trend remains above 3%[5] for a duration of at least 1 year. Exhibit 2 shows the results of this methodology when applied from December 1978. 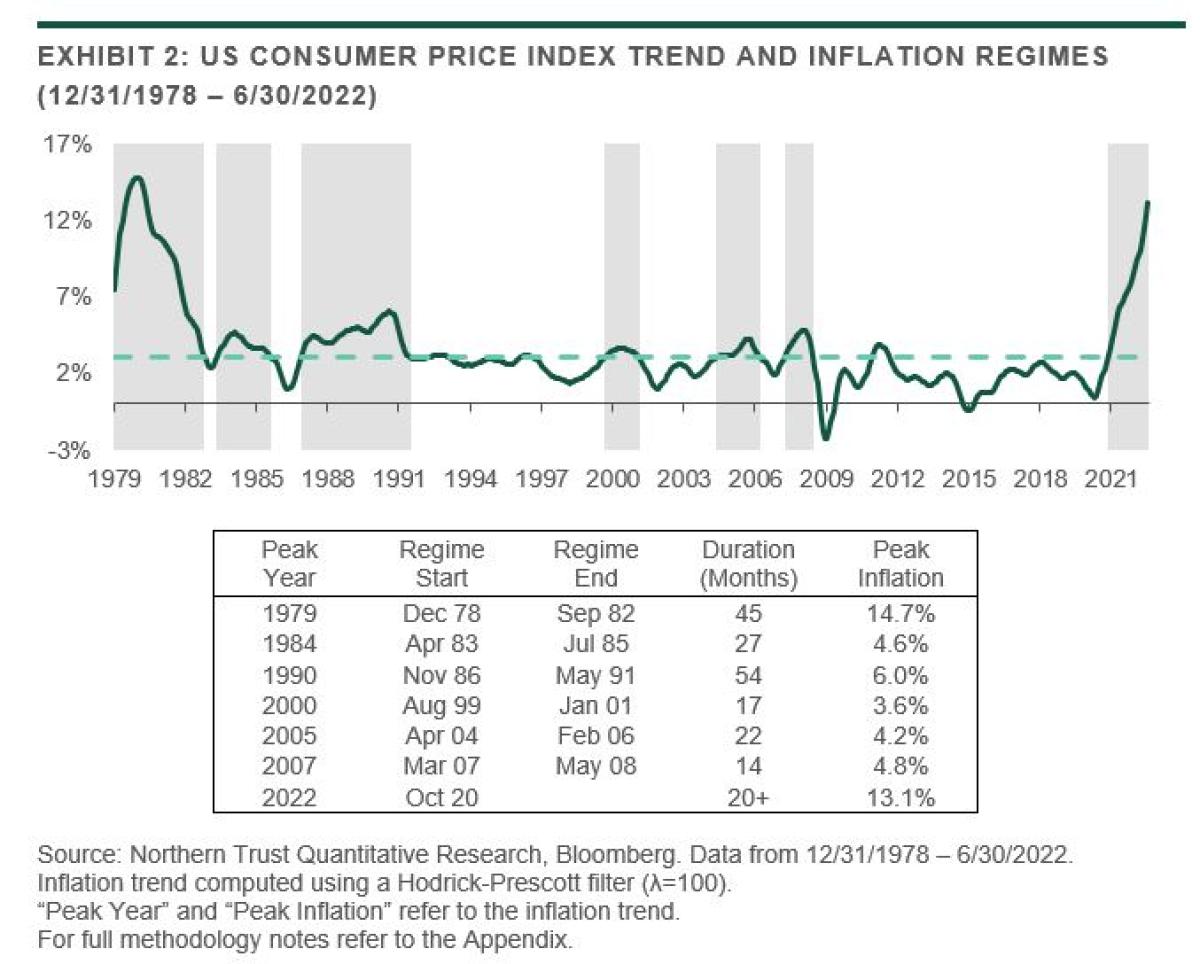
The results shown in Exhibit 2 highlight one of the main challenges with inflation analysis. When applying our criteria we have identified seven (7) distinct episodes, of which only six (6) have fully completed. We must therefore be mindful of our “confidence intervals” given that we are analyzing so few observations. Another challenge we face is the difficulty in isolating the impact of inflation from the broader economy, and by extension, the market response. Not only are growth and inflation closely linked, but their relationship is also circular – inflation affects growth, and growth affects inflation. Therefore, the extent to which the market is reacting to inflation at any point in time is difficult to ascertain. While remaining cognizant of these challenges we proceed to the next step in our analysis.
Establishing the baseline In order to evaluate the significance of reaching peak inflation we first need a baseline for comparison. Exhibit 3 shows the annualized, median[6] active[7] factor returns for the Russell 1000 Index for the six full inflationary episodes over our time horizon (refer to Exhibit A of the appendix for full details and MSCI World Index data). 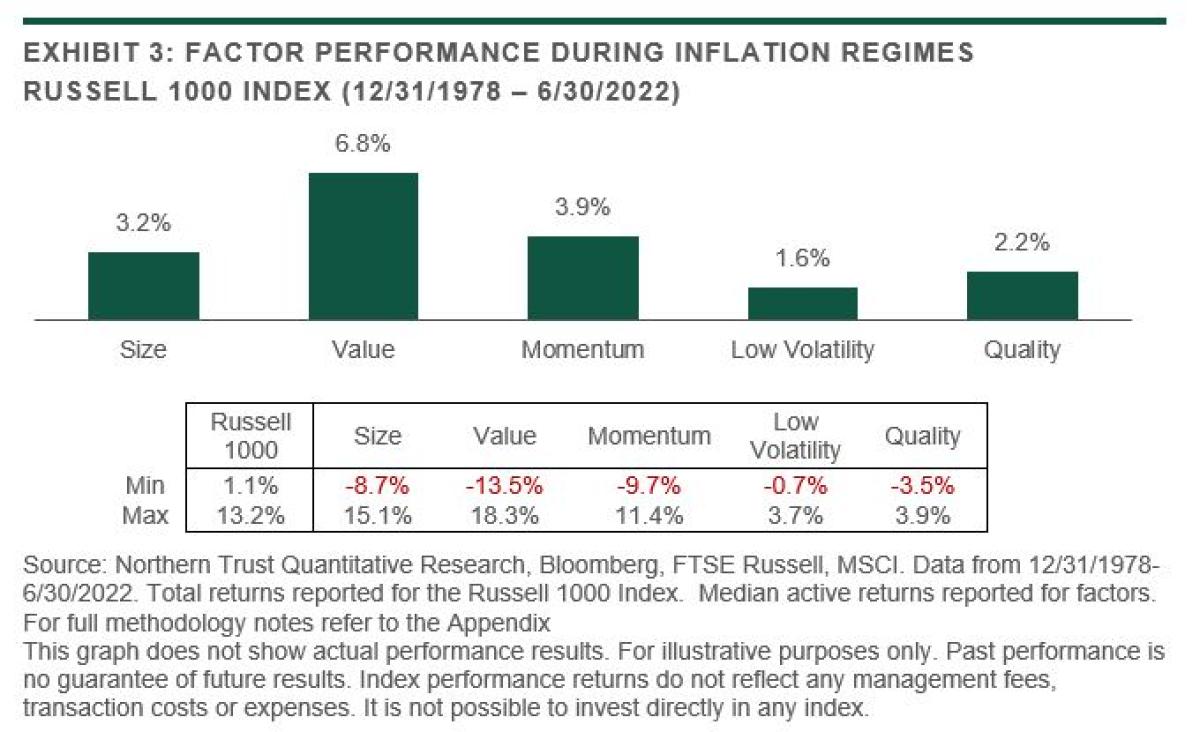
The results reported in Exhibit 3 are consistent with recent factor performance, as factors have outperformed the market on average during inflationary regimes. Perhaps not surprisingly value has performed the best historically, consistent with the notion that value stocks do well when future discount rates rise. Rising inflation often leads to rising interest rates as central banks attempt to reign in prices. PE compression tends to be greater in growth stocks than value stocks in a rising interest rate environment.[8] The min and max values imply significant dispersion in factor returns, as the range of active returns for size, value, and momentum, is greater than the range of total returns for the market itself (the Russell 1000 Index). This indicates heightened cross-sectional variation during inflationary episodes, as certain companies (industries) are better positioned than others to adjust to inflationary pressures.
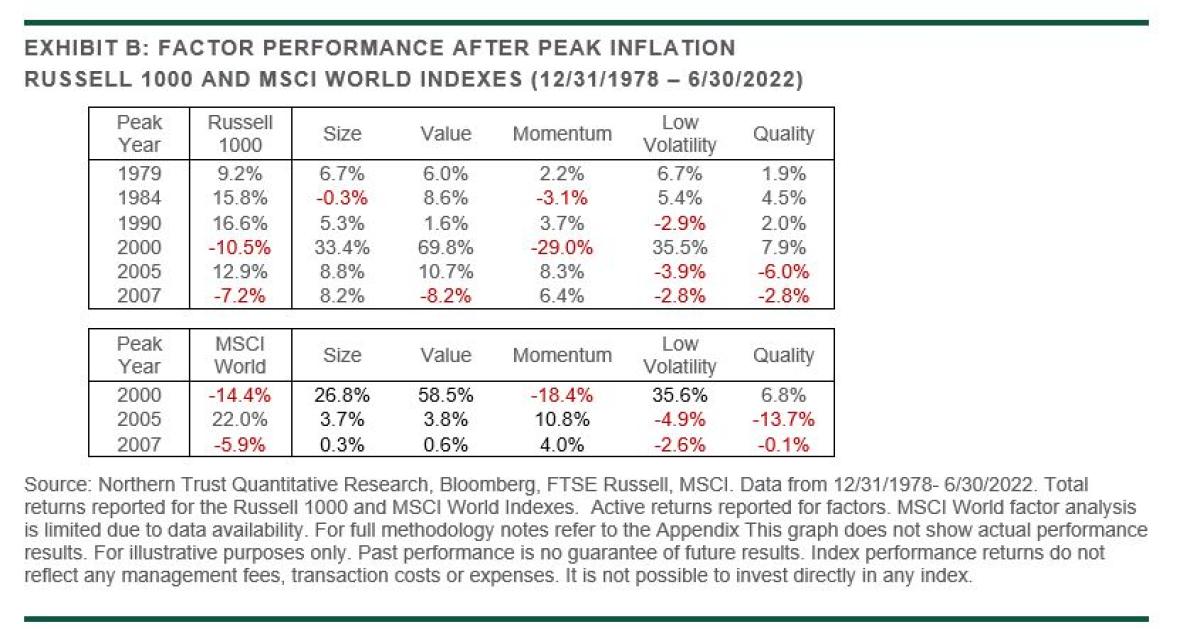
The impact of inflation normalization Having established a baseline, we can now measure the marginal impact of moving past peak inflation. Exhibit 4 repeats the analysis shown in Exhibit 3, including only the period from peak inflation to the end of the inflationary episode (when the inflation trend falls below 3%). The median active factor returns of the full inflationary episode are included for comparison (refer to Exhibit B of the appendix for full details and MSCI World Index data). 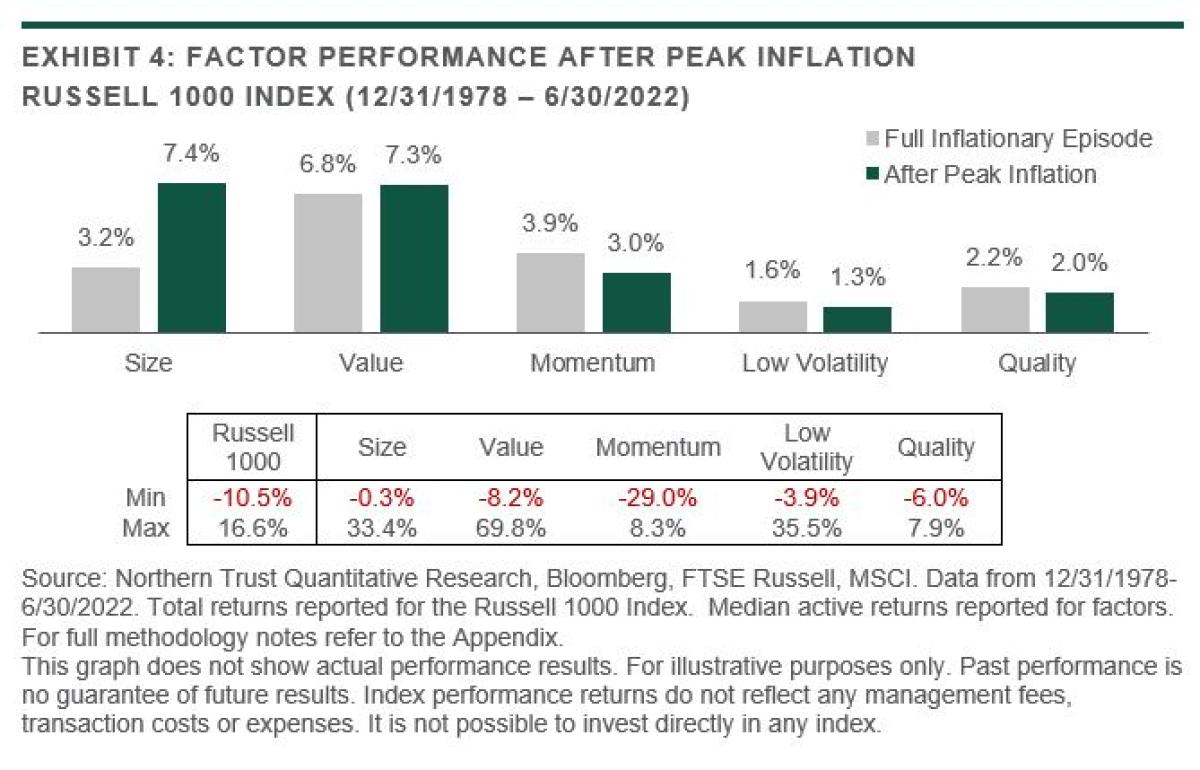
When comparing the median active returns after peak inflation to the full episode, we note that size now joins value among the top-performing factors. This result supports the view that smaller companies have less pricing power than larger firms, and therefore benefit more from falling inflation. The fact that the median value premium remains high is somewhat counterintuitive given the strength of the current relationship between value and interest rates[9]. As inflation begins to fall one may reasonably assume that investor expectations of future interest rates are also falling. Declining interest rates ought to disproportionately favor growth stocks whose present value of future earnings is quite sensitive to future discount rates. One potential explanation for value’s sustained performance is the simple recognition that investors revise their expectations of growth as well as interest rates. Conventional wisdom alleges that high inflation begets slowing growth, which can lead to reductions in forward earnings. These revisions may more than offset the impact of falling discount rates, leading to continued multiples compression for the growth cohort. Conversely, in some cases, the adverse impact of rising inflation may have been overestimated. Only after inflation begins to normalize are the prospects for these value firms adjusted accordingly[10]. Of course, these explanations conform to the classic behavioral interpretation of the value premium which asserts that investors tend to extrapolate information too far, becoming too optimistic (or pessimistic) in their projections. This rationale is consistent with the data presented, as the biases responsible for the value premium are agnostic to the level or direction of interest rates. Relative to our baseline, the range of returns reported in Exhibit 4 has increased considerably, suggesting that the transition to inflation normalization is both difficult to characterize and warrants caution from tactical investors. The minimum active return for momentum has decreased appreciably, consistent with the tendency for momentum to underperform during changing market regimes. We next evaluate the inflation transition period to contrast the impact of a “hard landing” to that of a “soft landing.”[11] We begin our analysis by focusing first on aggregate equity market performance in the context of growth. For the purpose of our analysis we define the “transition period” to be the 1-year period spanning the last 6 months of the inflationary episode and the first 6 months after the inflationary episode (i.e., the first 6 months of the inflation trend remaining below 3%). Exhibit 5 reports the following data for each inflationary episode over the analysis horizon: GDP growth rates leading into and during the transition period, the return of the Russell 1000 Index, and recession start and end dates (if applicable). 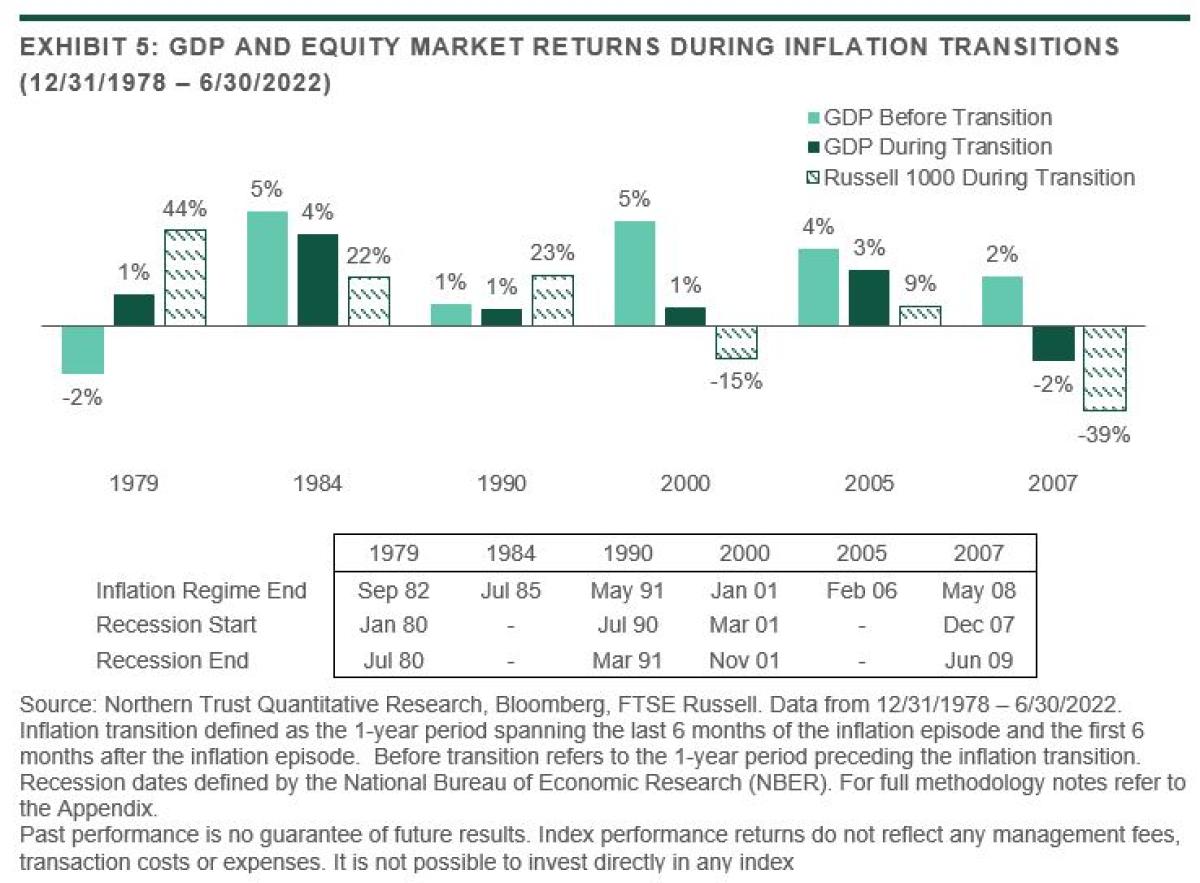
The data reported in Exhibit 5 shows that only 2 of the 6 episodes avoided recession. The inflationary transitions of 1984 and 2005 both experienced slowing growth, but the economic expansion was sustained. The equity markets responded favorably to these “soft landings”, returning 22% and 9%, respectively. The other four regimes were each accompanied by a recession, but the timing varied. In 1979 and 1990, the economy was coming out of recession as inflation normalized, whereas in 2000 and 2007 the economy was falling into recession during the transition. This highlights the circular relationship between growth and inflation that was referenced earlier. In the “tech wreck” and global financial crisis, inflation was falling in response to collapsing growth. In 1979 and 1990, growth was rising in response to falling inflation. For tactical investors, these are important distinctions, as evidenced by the extreme range of equity market returns associated with these “hard landings.” Most investors equate the current inflation regime to the 1980s, and the consensus appears to be forming that a recession is looming. Should these assumptions hold, Exhibit 5 suggests that an economic recovery may precede inflation normalization. Exhibit 6 reports factor performance for the inflation transition period. 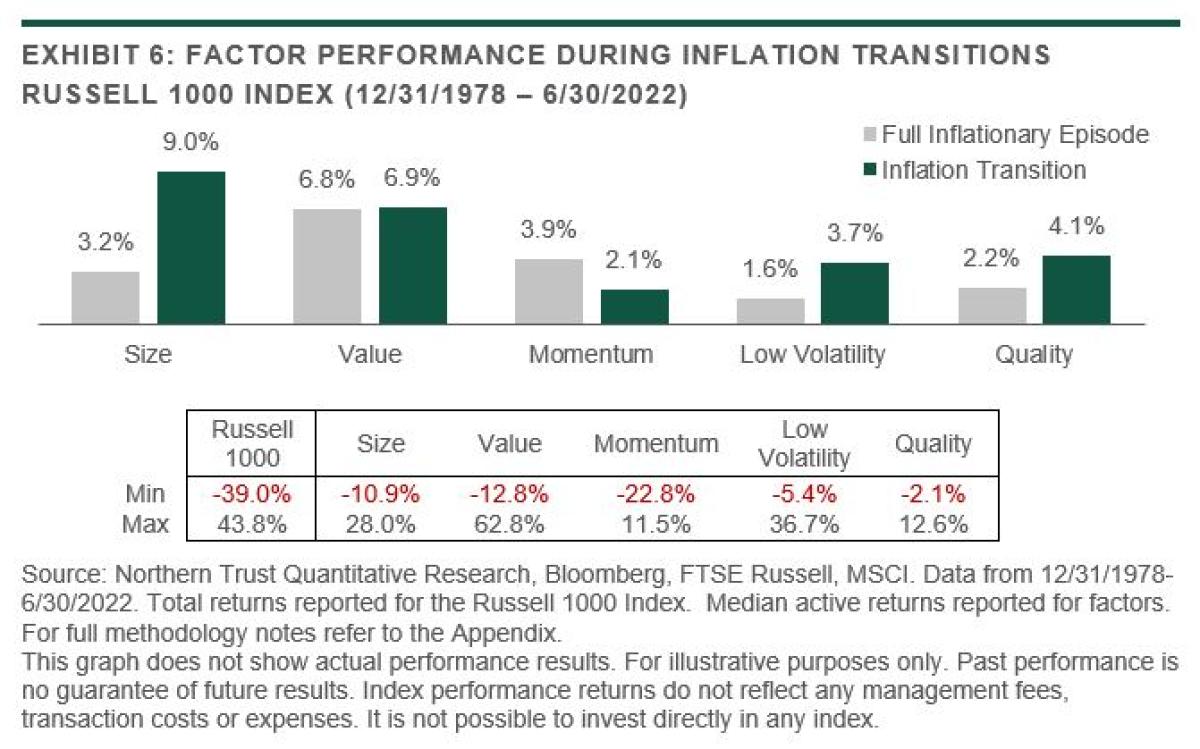
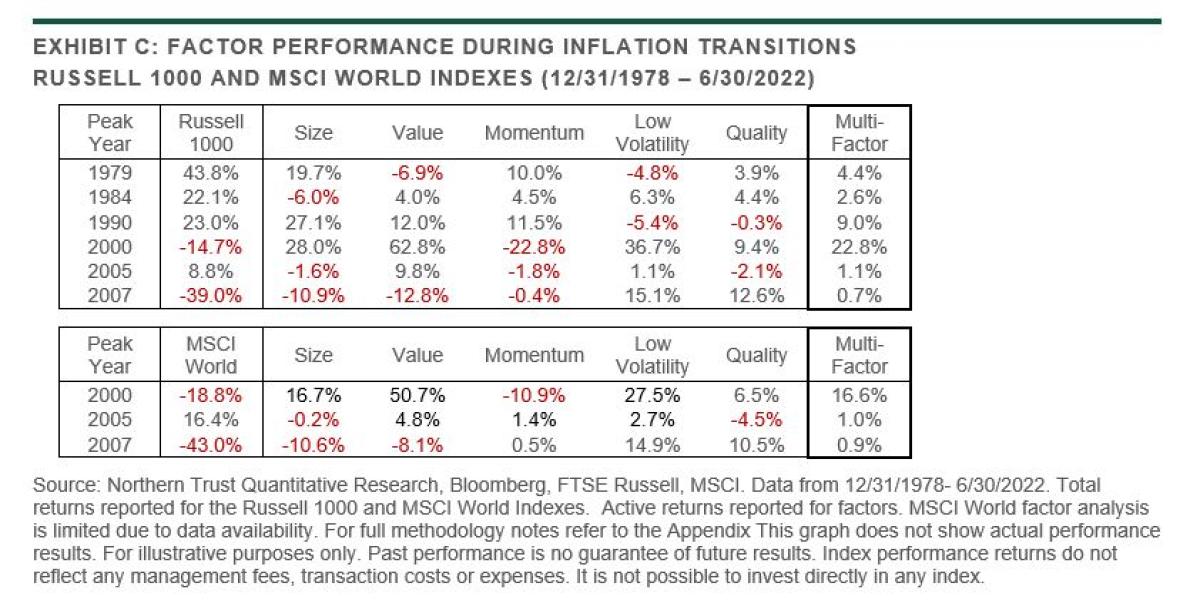
In general, the results reported in Exhibit 6 (inflation transitions) are similar to those reported in Exhibit 4 (after peak inflation), with all median active factor returns remaining positive. The range of active factor returns remains remarkably wide affirming that inflation transitions provide differentiated responses among factors[12], while further underscoring the risk of tactical positioning. As an alternative to factor timing, Exhibit 7 illustrates the benefits of a multi-factor approach using a naïve, equally weighted blend of the five factors (refer to Exhibit C of the appendix for full details and MSCI World Index data). 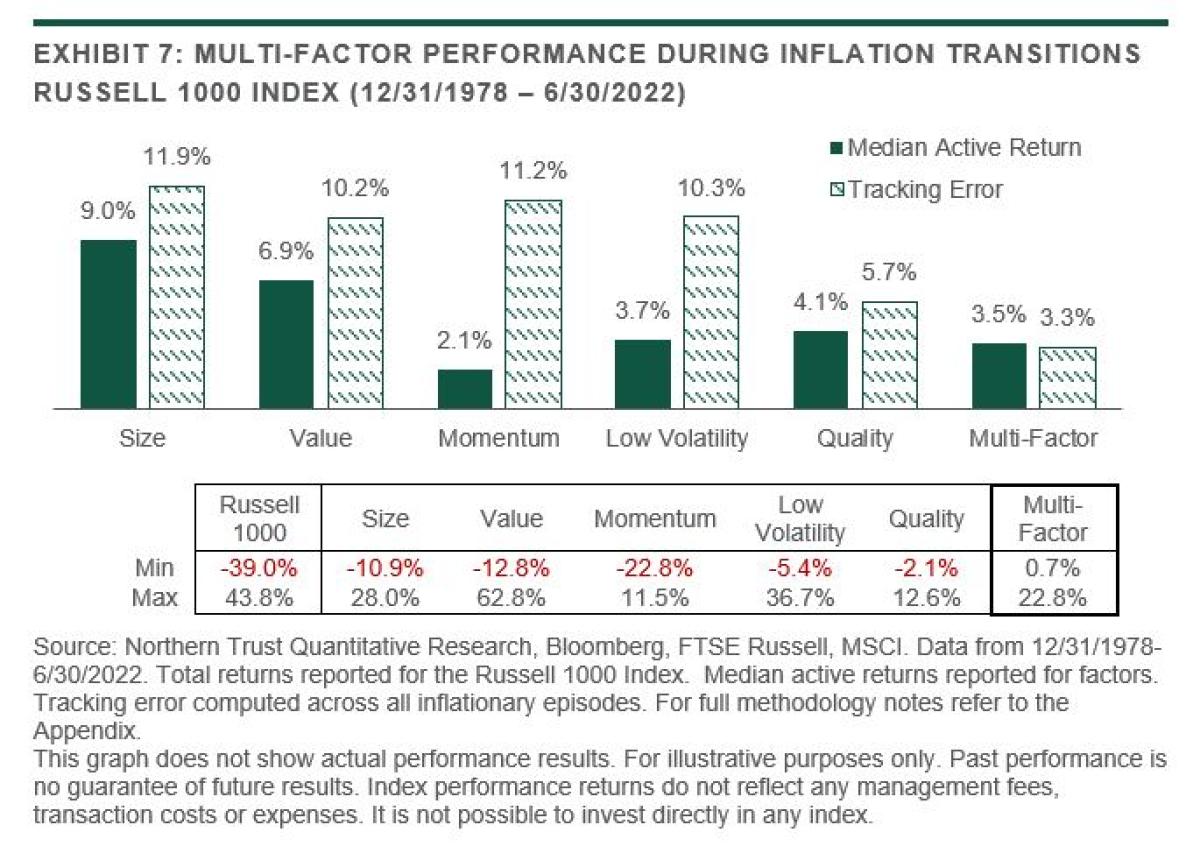
The results reported in Exhibit 7 highlight the merits of a multi-factor strategy relative to the individual factors: Downside risk is mitigated, much of the upside potential is retained, and tracking error is significantly reduced. While these results are purely hypothetical, we believe they represent an attractive alternative for investors who are either unsure about the direction of the economy or unwilling to assume the risks of market timing. Conclusion The current inflationary regime has been constructive for style factors, particularly value-oriented and defensive strategies. Aggressive monetary tightening and falling energy prices have investors wondering if an inflation reversal is imminent, and whether the outlook for style factors has diminished. Our analysis indicates that factors have performed well historically throughout the full inflationary episode, and that reaching peak inflation is non-consequential to expected factor returns. This finding is particularly noteworthy for value investors who have become conditioned to believe that value cannot outperform in a declining rate environment.
While average factor returns do not materially change throughout the inflationary episode, the dispersion of factor performance increases considerably as inflation transitions into a lower inflationary regime. This has implications for tactical investors as downside risk becomes elevated. We recommend a balanced, multi-factor strategy as an alternative to factor timing. We believe this approach mitigates the downside risk associated with any individual factor while retaining much of the upside potential. Footnotes: [1] The US Consumer Price Index was updated through June 2022 on July 13, 2022. [2] The US Consumer Price Index breached 3% on a year-over-year basis on March 31, 2021. From March 2021 through June 2022 the active factor returns of the MSCI World Index were as follows: Value 2.8%, Dividend Yield 11.0%, Low Volatility 10.1%, and Quality 3.8%. For full methodology notes refer to the Appendix. [3] See Hodrick and Prescott (1997). [4] The HP filter also removes the cyclical (business cycle) component of a macro time series which was not used in this analysis. [5] 3% represents the median inflation trend over the reported time period. [6] Median returns are reported in lieu of average returns in order to mitigate outliers which skew the results. [7] Active returns denote returns in excess of the market cap-weighted index. [8] See “The Great Inflation, Factors and Stock Returns” by OSAM (2021). [9] Refer to our paper What’s Driving Value? for more information. [10] Both potential explanations may also apply to the increase in the size premium after peak inflation. [11] “Hard” and “soft” landings both refer to economic outcomes that are perceived to be a result of central bank tightening. Per a congressional research report (2022), “soft landing” refers to economic conditions whereby growth is moderate but positive, while a “hard landing” is associated with an economic recession. [12] See Gupta, Kassam, et al. (2014). References Hodrick, Robert, & Prescott, Edward C. (1997). Postwar U.S. Business Cycles: An Empirical Investigation. Journal of Money, Credit, and Banking, 29(1), 1-16. O'Shaughnessy Asset Management. (2021). The Great Inflation, Factors and Stock Returns. White Paper. Wang, Di, & Lehnherr, Rob. (2022). What’s Driving Value? Northern Trust Asset Management. White Paper. Gupta, Abhishek, Kassam, Altaf, Suryanarayanan, Raghu, & Varg, Katalin. (2014). Index Performance in Changing Economic Environments. MSCI Research Insights. Congressional Research Service Insight. (2022). Where is the U.S. Economy Headed: Soft Landing, Hard Landing, or Stagflation? About the Authors: Daniel Fang is a Vice President at The Northern Trust Company, Chicago and Sr. Quantitative Research Analyst responsible for quantitative equity, fixed income and multi-asset strategy research, design and development. Daniel brings more than 13 years' experiences in quantitative finance in areas of quantitative research, portfolio management and risk modelling. 
Prior to joining Northern Trust, Daniel was a Research Analyst at Nuveen Investments where he co-managed two income funds and worked on asset valuation and asset allocation research. Prior to Nuveen, Daniel spent 4 years at Allstate Investments as a quantitative researcher focused on asset allocation, derivative modelling and risk management. Daniel started his career in Finance at Group One Trading, a CBEO designated option trading firm in Chicago, in 2009.
Daniel has a master's degree in financial mathematics from University of Chicago and a B.A. degree in Hydraulic Engineering from Tsinghua University, China. Daniel also studied in doctoral program at Georgia Institute of Technology where he earned a master's degree in civil engineering. Jim Johnson is an Investment Strategist and Senior Vice President with the Quantitative Strategies Group at Northern Trust Asset Management.
Prior to joining Northern Trust in July 2020, he spent 8 years at TIAA/Nuveen where he managed over $12 billion in active quantitative stock selection strategies that he designed from scratch. Prior to TIAA, Jim spent 7 years as a portfolio manager at State Street Global Advisors, where he was part of a 75+ person global quantitative team. Before SSgA, he ran a small quantitative team at American Express Financial Advisors, now Ameriprise. Jim has a BS in Music Engineering from the University of Miami (FL), and an MBA with a Finance Concentration from the University of Minnesota Carlson School of Business. Jim is a CFA charter holder, a member of the CFA Institute, and the CFA Society of Chicago. He is also a member of the Chicago Quantitative Alliance. Rob Lehnherr is Head of Quantitative Equity Research at Northern Trust Asset Management.
Rob is a member of the CFA Society Chicago, CFA Institute. Appendix 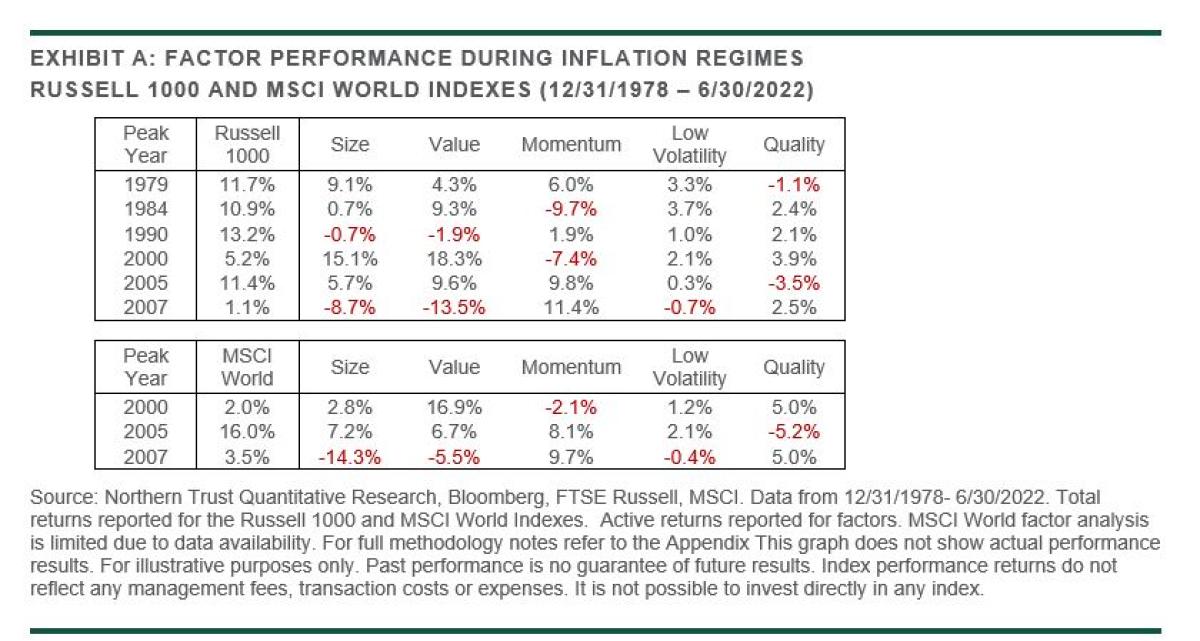
|
 Search
 Close
Close