


By Rick Ratkowski, CFA, Director, Investment Strategies at NISA.
In just eight days, the U.K.’s bond market became so disrupted that the Bank of England (BoE) stepped in to backstop the gilt market on September 28th. Between September 19th and September 27th, 2022, U.K. 30-year inflation-linked bond yields rose from -5 bps to 189 bps, a net change of 194 bps resulting in a 42% loss. Nominal U.K. 30-year gilt yields fared marginally better over the same period with yields rising 154 bps, a loss of 28%.
Notably, U.K. LDI strategies played a contributing role in the large market selloff. While moves such as these can strain any system, structural elements of the U.K. market made these moves difficult for the market to bear and ultimately required the BoE to step in.
A confluence of events paints a mosaic of what happened and why, and at least after a thorough assessment, gives substantial comfort as to why these events appear materially less likely to occur in U.S. LDI strategies.
We will look at four key differences that, although independent, have an interconnectedness that ultimately compounded the severity during late September.
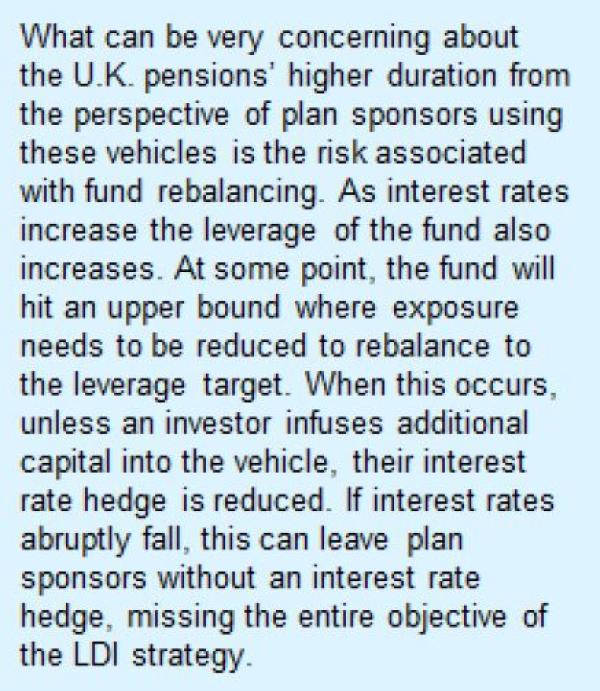
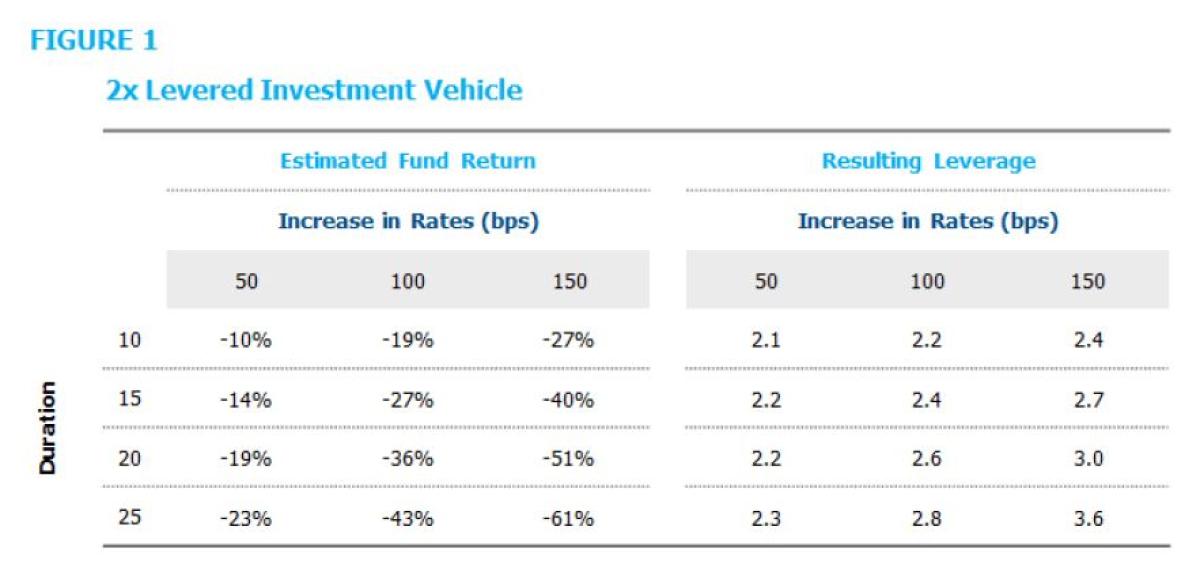
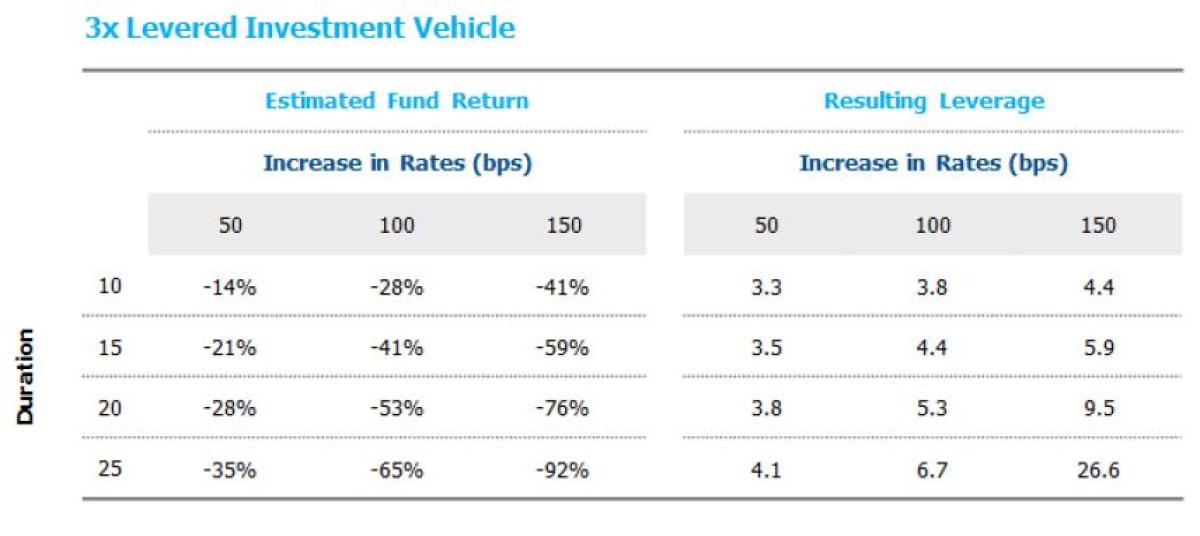
1. Pooled Levered Investment Vehicles - About 15% of U.K. LDI assets are invested in pooled vehicles1, which allow multiple investors into a single investment structure. When these funds employ leverage, as they do frequently in the U.K., the fund may have terms allowing it to ask for more collateral or have rebalancing rules, which can cause forced unwinds during market sell-offs. According to the 2019 Pension Regulator report on leverage and liquidity, the mean leverage target reported for pooled vehicles was ~4x with typical ranges between 1x-6x. Unfortunately, the leverage target doesn’t tell us the underlying risk in a particular investment. A 4x levered 10-duration fund would have roughly the same interest rate risk as a 2x levered 20- duration fund. As such, we have provided a variety of leverage targets and duration objectives to show the potency when mixing higher leverage and duration. The data illustrated in Figure 1 provides a sense of how, depending on leverage and duration, a fund’s leverage ratio can quickly spiral out of control. As rates increase, losses lead to increased leverage. Funds respond by selling assets, putting more pressure on interest rates. In extreme moves, this can lead to a vicious upward rate cycle leading to potential insolvency of funds. Note: given the large rate moves (and leverage), a convexity adjustment was made as opposed to just using a duration multiplied by rate movement approximation.
Keep in mind U.K. pensions have an average duration of ~15-20 years2, which is materially longer than the average U.S. pension liability of ~12 years.
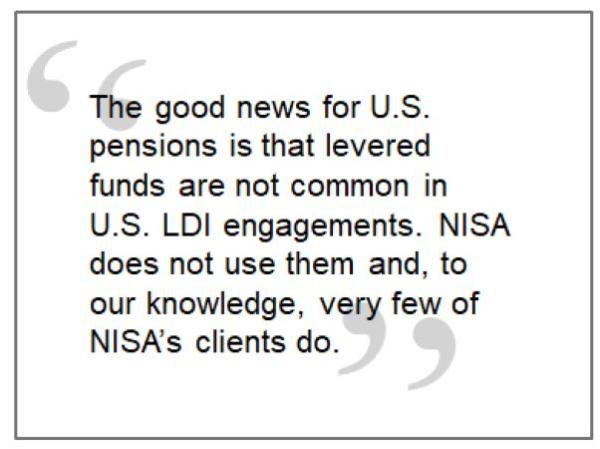
The good news for U.S. pensions is that levered funds are not common in U.S. LDI engagements. NISA does not use them and to our knowledge, very few of NISA’s clients do. When derivatives are utilized, the portfolios are structured as separately managed accounts (SMA) where the client and its asset manager are responsible for ensuring adequate amounts of collateral are readily available. This means planning for primary, secondary, and even tertiary sources of collateral. It may be subtle, but this creates an enormous difference in market structure vs. the U.K. A levered fund, which has no (or limited) recourse to additional pension assets, creates a limitation on how collateral calls on synthetic positions can be satisfied. A levered fund’s recourse is likely limited to the assets within the fund, while an SMA has the full weight of the pension trust behind it. While a U.K. pension could consider providing additional capital to a levered fund to satisfy collateral calls, it may choose not to do so because the benefit of that contribution would be shared by all members of the fund, not just the contributing member3. SMA’s have greater recourse than pooled funds, which thereby allows deeper collateral pools and more flexible margin requirements (generally not needing to post initial margin for non-cleared derivatives). Pooled funds do not have this luxury, leading to the potential need to add additional assets to the fund.
2. Use of Cleared Swaps – While not required, cleared interest rate swaps and inflation swaps are common in the U.K. These instruments require variation margin payments to be made in cash. In the 2019 Liquidity and Leverage report, interest rate swaps represented 42% of total derivative notional, and inflation swaps represented an additional 17%. Total return swaps, which allow for noncash collateral posting, represented <10% of overall U.K. exposure. Cleared swaps also require initial margin, which can result in an additional 10% of market value being unavailable for variation margin. This increases the leverage risk in the pooled investment vehicle. Importantly, even when U.K. pensions do not use pooled investment vehicles but still choose to utilize cleared derivatives, they would need to post margin in cash. This negates the ability to post government bonds to satisfy margin obligations — a valuable tool. Without it, investors are required to sell government bonds into an already challenged market.
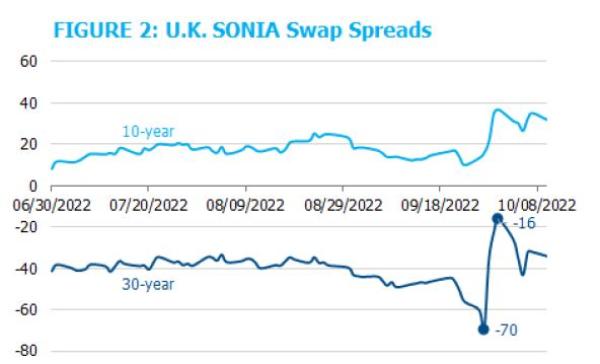
When taken in combination, the heavy reliance on levered funds and cleared instruments provides structural vulnerability to a classic “run dynamic,” using a banking analogy. Examining 30-year U.K. Sterling Overnight Index Average (SONIA) swap spreads from late September seems to support this narrative. Figure 2 shows 30-year swap spreads averaging -45 bps. On September 26th those spreads became even more negative and decreased to -70 bps. This would be consistent with selling pressure in the U.K. gilt market, driving swap spreads further negative. Moreover, the next day swap spreads increased dramatically to -16 bps. While this move is consistent with rebalancing in levered funds, other factors could be at play. As an example, U.K. pensions may hold some U.S. debt, which if sold to raise collateral, could impact U.K. interest rate swaps4. While we can’t directly pinpoint a cause, the large movements in derivative markets relative to the cash gilt market indicate something was amiss.
3. Higher Relative Derivative Usage – Using the 2019 U.K. Pension Regulator Report, NISA estimates between $400- $500b in interest rate and inflation-linked derivatives for U.K. pension plans5, suggesting over 25% of U.K. pension interest rate hedges come from derivative markets. In the U.S., we estimate <10% of hedges come from derivative positions.
Our estimate is derived from the following: NISA manages around $100b of U.S. interest rate derivatives for LDI programs as of September 30, 2022. Looking at 2022 P&I rankings of overlay managers and estimating that NISA’s overlay programs represent a significant proportion of U.S. pension liabilities, it would be difficult to see the total interest rate derivative usage in the U.S. to be much larger than $250b, and conceivably could be smaller than $150b. Even using the larger estimate, this would suggest <10% of interest rate hedges coming from derivatives, given a relevant U.S. pension market of $2.5T.
Corroborating NISA’s estimate of U.K. pension derivative usage, the following excerpt from a letter dated 10/5/2022 from the BoE Deputy Governor to the Chair of the House Treasury Committee of the House of Commons6:
“Through the day and into the evening, the Bank received market intelligence of increasing severity from a range of market participants, and in particular from LDI fund managers, reporting that conditions in core markets, should they continue to worsen, would force them to sell large quantities of long-term gilts in an increasingly illiquid market. Taken at face value, this market intelligence would have implied additional long-term gilt sales of at least £50 billion [emphasis added] in a short space of time, as compared to recent average market trading volumes of just £12 billion per day in these.”
Based on the £50b of estimated collateral needs for 80 bps of interest rate movements mentioned earlier in the letter7, a range of derivative notional sizes can be established based on the potential duration of the exposure. See Figure 3.5
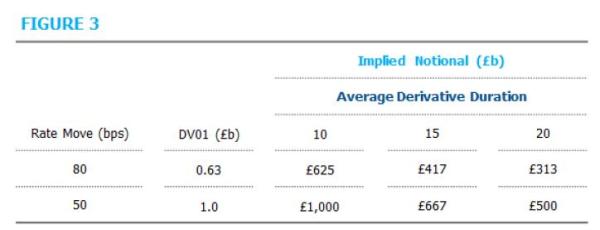
We view these estimates as representing the low end of the range as the BoE’s comments mentioned “at least £50b in sales” and importantly, not all U.K. interest derivatives are cleared and therefore demand cash margining. So, while there is a range of potential estimates on relative derivative usage, it is immediately clear that U.K. pensions use a substantial amount of derivatives (whether in pooled vehicles or in SMAs) relative to U.S. plans.
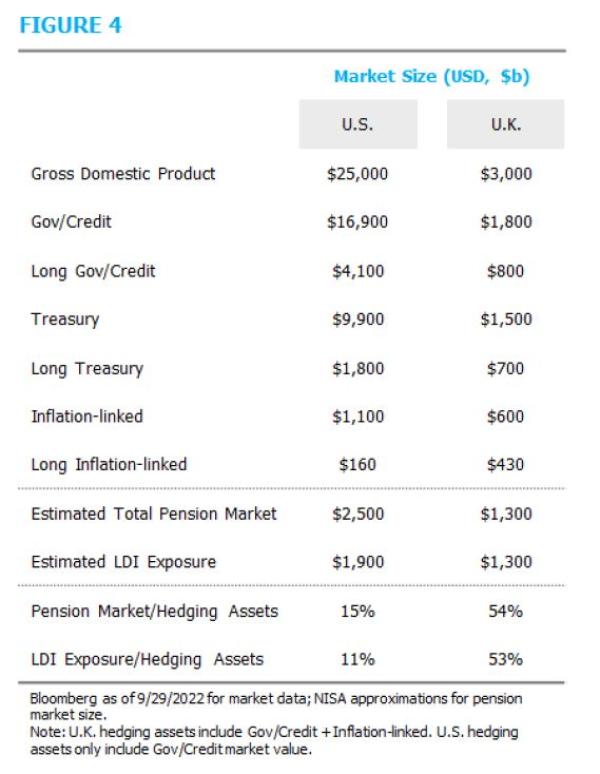
4. Relative Market Size vs. Pension Size – The PPF Purple Book shows U.K. DB Pension Scheme assets as of March 31, 2021, at £1.72T of assets with liabilities of £1.67T for a slightly overfunded position. While numbers in this range have been used by various media sources, we need to make material adjustments to reflect recent market moves. We would estimate 30- year gilt yields have increased by around 220 bps from March-2021 through mid-September. Based on the duration estimates presented earlier, this would suggest U.K. liabilities have decreased to around £1.1T with assets around the same level.8 Adjusting for potential market moves and flows since 2020, we currently estimate the U.K. LDI (physicals and derivatives) around £1.1T. This seems a little high because it implies a hedge ratio of around 100%, however, given a 72% bond allocation and the BoE stating a £50b collateral posting could be needed, this doesn’t seem unreasonable9. This estimated size of the U.K. pension market can be compared to the potential pool of physical hedging assets. Figure 4 illustrates how the size of hedging assets in the U.K. stacks up to the U.S. While there are a large number of adjustments and assumptions behind these numbers, the U.K. pension market consumes a materially larger portion of hedge assets than U.S. corporate pension plans10.
Speaking to the interconnectedness of these issues, it is not surprising to see higher derivative usage, given the lack of a substantial U.K. corporate bond market.
Finally, during September, gilt selling for collateral needs put even more upward pressure on interest rates. A quick look at trading volume makes it very obvious why. The volume numbers for the first half of 2022, which represent the dealer-to-customer market, provide some perspective. First, as mentioned earlier, the BoE was concerned about £50b of potential gilt sales as a result of interest rate moves. If the sales were primarily from long-end gilts, this would represent over 10x the average daily volume. Using the BoE’s volume estimate of £12b, this represented 4x the average daily volume.
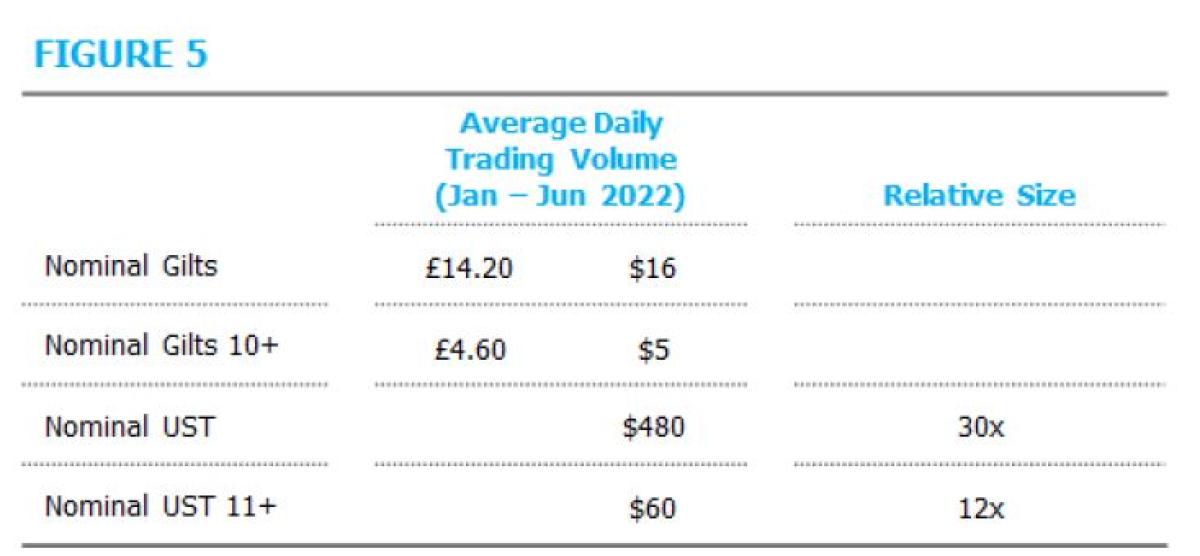
In order for U.S. LDI programs to have the same potential market impact in U.S. markets, ~240b in U.S. Treasuries would need to be sold. Given the size of U.S. interest rate derivative usage, this stretches the imagination. Recall, earlier we estimated LDI programs to be only 150b-250b of U.S. interest rate derivatives.
U.S. Readiness
While so far we have focused on structural differences, it is worth stepping back to understand how ready U.S. plan sponsors are for potential sell-offs in interest rates. As an example, Figure 6 illustrates two asset allocations for plans using derivatives. The first represents a plan with a high-return-seeking asset allocation targeting a 100% interest rate hedge. The 2nd represents a hibernated plan with minimal use of overlay. Both scenarios assume the plan is 100% funded and has a 12-duration liability. Keep in mind, in some cases sponsors may choose to pursue a lower hedge ratio in which case the available collateral cushion would be even higher.
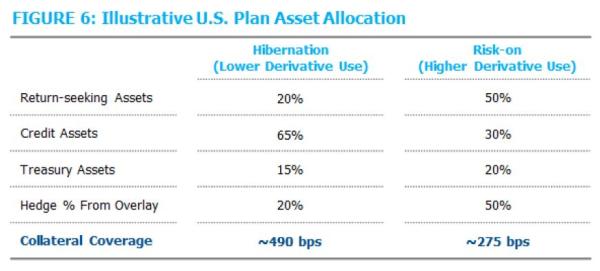
In Figure 6, only Treasury assets count towards meeting collateral needs. Treasuries can be settled into cash on the same day if needed for margin payments and directly available as collateral for many derivative transactions. Keep in mind corporate debt and public equities represent an even deeper collateral bench.12
While rate increases of the magnitude experienced in the U.K. would impact U.S. LDI programs, the structural differences between the two markets would have a far greater impact in the U.K. than would be expected in the U.S. When interest rates increase, the U.S. market has greater flexibility to respond. Lower derivative utilization in the U.S. reduces collateral needs, and a more robust physical bond market reduces the potential market impact from LDI programs. Implementations do not rely on levered pooled funds and use less cash-intensive derivatives. All of these factors provide greater flexibility and resiliency for U.S. LDI programs.
Footnotes:
1 While not all LDI pooled investment vehicles are levered, in the 2019 Pension Regulator Report titled “DB Pension Scheme Leverage and Liquidity Survey ”(https://www.thepensionsregulator.gov.uk/-/media/thepensionsregulator/fi…) LDI is considered separately from more traditional bond engagements seeming to indicate many of these are levered.
2 The 2019 Pension Regulator Report cited above, estimated an average of 20-years duration with a range between 11 and 31. Additionally, The 2021 PPF Purple Book (https://www.ppf.co.uk/news/purple-book-2021) estimated an average change in liabilities due to a 10bps change in interest rates of 1.9% or ~19years of duration. Of course, these were all estimated before the recent change in interest rates and can be complex given a combination of both real and nominal liabilities.
3 Levered funds can have the ability to call for more collateral. However, obligations can differ for each investment structure.
4 It is common for U.K pensions to buy foreign debt and then interest rate hedge back to the U.K. This is accomplished by selling the foreign rate exposure on swap (e.g., U.S.) and buying the domestic rate exposure (e.g., U.K.) on swap. The same day that U.K. swap spreads widened (became less negative), U.S. swap spreads tightened (became more negative). This would also be consistent with the type of market move we noticed.
5 This is where forensic finance comes into action. The 2019 Leverage report indicates around £350b GBP in interest rate derivatives. This report represented 46% of pension assets at the time, indicating the total market size of around £700b. Given interest rate moves, we then estimate the market value of those positions may have fallen by around 40%. Additionally, we need to account for changes in the scheme’s funded status and the increase in physical fixed income allocations (increased from 60% in 2019 to 70% in 2021). The key point is U.K. pensions use a lot of derivatives.
6 https://committees.parliament.uk/publications/30136/documents/174584/de…
7 The letter is not entirely clear upon which size rate movement the £50b collateral move is based on, as such we have provided two rate move scenarios.
8 This number excludes local pension schemes, which represent several hundred billion of value. Although these plans generally do not use LDI, they do hold fixed income assets, which consume part of the available asset pool.
9 The 100% hedge ratio is assumed to be a funding basis, some Schemes may hedge on a windup basis which would result in a funding hedge ratio of >100%.
10 Determining the size of the U.K. pension market was a surprisingly difficult question given all the moving pieces and market volatility. Changing relative pension market sizes in either the U.S. or U.K. by +/- a couple hundred billion doesn’t really impact
conclusions.
11 U.S. trading volume: (https://www.newyorkfed.org/markets/counterparties/primary-dealers-stati…), U.K. trading volume: (https://www.dmo.gov.uk/data/gilt-market/turnover-data/). It’s unfortunate but the 11+ vs 10+ is not a typo just how the data is reported.
12 Public equities are often overlooked as a collateral source because investors tend to be reluctant to sell when the market is down. However, simply replacing a public equity allocation with cash + overlay keeps an investor in the market and provides additional sources of cash liquidity.
About the Author:
Rick Ratkowski, CFA, Director, Investment Strategies at NISA.

DISCLAIMER
By accepting this material, you acknowledge, understand and accept the following: This material has been prepared by NISA Investment Advisors, LLC (“NISA”). This material is subject to change without notice. This document is for information and illustrative purposes only. It is not, and should not be regarded as “investment advice” or as a “recommendation” regarding a course of action, including without limitation as those terms are used in any applicable law or regulation. This information is provided with the understanding that with respect to the material provided herein (i) NISA is not acting in a fiduciary or advisory capacity under any contract with you, or any applicable law or regulation, (ii) that you will make your own independent decision with respect to any course of action in connection herewith, as to whether such course of action is appropriate or proper based on your own judgment and your specific circumstances and objectives, (iii) that you are capable of understanding and assessing the merits of a course of action and evaluating investment risks independently, and (iv) to the extent you are acting with respect to an ERISA plan, you are deemed to represent to NISA that you qualify and shall be treated as an independent fiduciary for purposes of applicable regulation. NISA does not purport to and does not, in any fashion, provide tax, accounting, actuarial, recordkeeping, legal, broker/dealer or any related services. You should consult your advisors with respect to these areas and the material presented herein. You may not rely on the material contained herein. NISA shall not have any liability for any damages of any kind whatsoever relating to this material. No part of this document may be reproduced in any manner, in whole or in part, without the written permission of NISA except for your internal use. This material is being provided to you at no cost and any fees paid by you to NISA are solely for the provision of investment management services pursuant to a written agreement. All of the foregoing statements apply regardless of (i) whether you now currently or may in the future become a client of NISA and (ii) the terms contained in any applicable investment management agreement or similar contract between you and NISA.