


By D.E. Shaw.
Introduction
Over the past decade, after years of remaining relatively tightly clustered, the sensitivities of stocks to movements in interest rates have become more dispersed at the individual stock, sector, and style factor levels. In other words, there isn’t just a single “stock-bond correlation.” As a result, equity portfolios could, depending on their composition, perform in unanticipated ways relative to historical portfolios for which stock-bond correlations were mostly uniform. In particular, investors in sector and style factor portfolios, as well as in many commercial equity benchmarks, may now be exposed to meaningfully more active interest rate risk than, say, ten years ago.
In this paper, we present analyses showing the stark increase in dispersion in the sensitivities of U.S. stocks to the 10-year U.S. Treasury note since 2012; we then consider how the expansion of the U.S. Federal Reserve’s balance sheet and its impact on Treasury yields may have been a driver of this phenomenon.
This shift has clear implications for investors, as we believe that taking into account the cross-sectional heterogeneity in rate sensitivities can help improve risk management, portfolio design, performance assessments, and asset allocation decisions.
Interest Rate Sensitivity in U.S. Stocks: A Tale of Two Decades
We first examine the sensitivity of U.S. stock returns to movements in U.S. government bonds over the past two decades. (We show broadly similar results for certain non-U.S. markets in the Appendix.) The key variable in our analysis is “Treasury beta,” which we define as a stock’s idiosyncratic sensitivity to the 10-year U.S. Treasury note. We compute Treasury beta using a multivariate regression of daily stock (or stock portfolio) returns on 10-year Treasury returns and the overall equity market.1 Treasury beta therefore represents a stock’s excess sensitivity to movements in the 10-year Treasury note while accounting for its equity market beta.
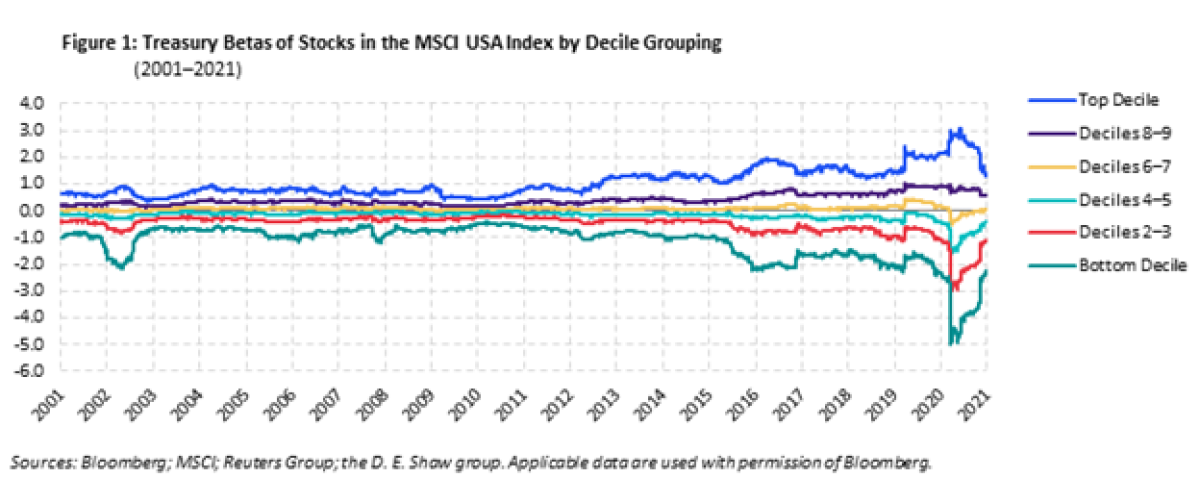
To track interest rate sensitivities through time, we sorted U.S. stocks into deciles by Treasury beta and combined them into groups of two deciles except for the top and bottom deciles. Figure 1 graphs the average Treasury beta exhibited by stocks within each grouping over the 2001–2021 period.2 The regression coefficients arrayed on the vertical axis can be interpreted as the average incremental stock return within each grouping associated with changes in Treasury prices, having adjusted for overall equity market beta.3 For example, a Treasury beta of 0.50 suggests that a positive 1% return on 10-year Treasuries is associated with a stock return of 0.5% in excess of the return due to that stock’s equity market beta.
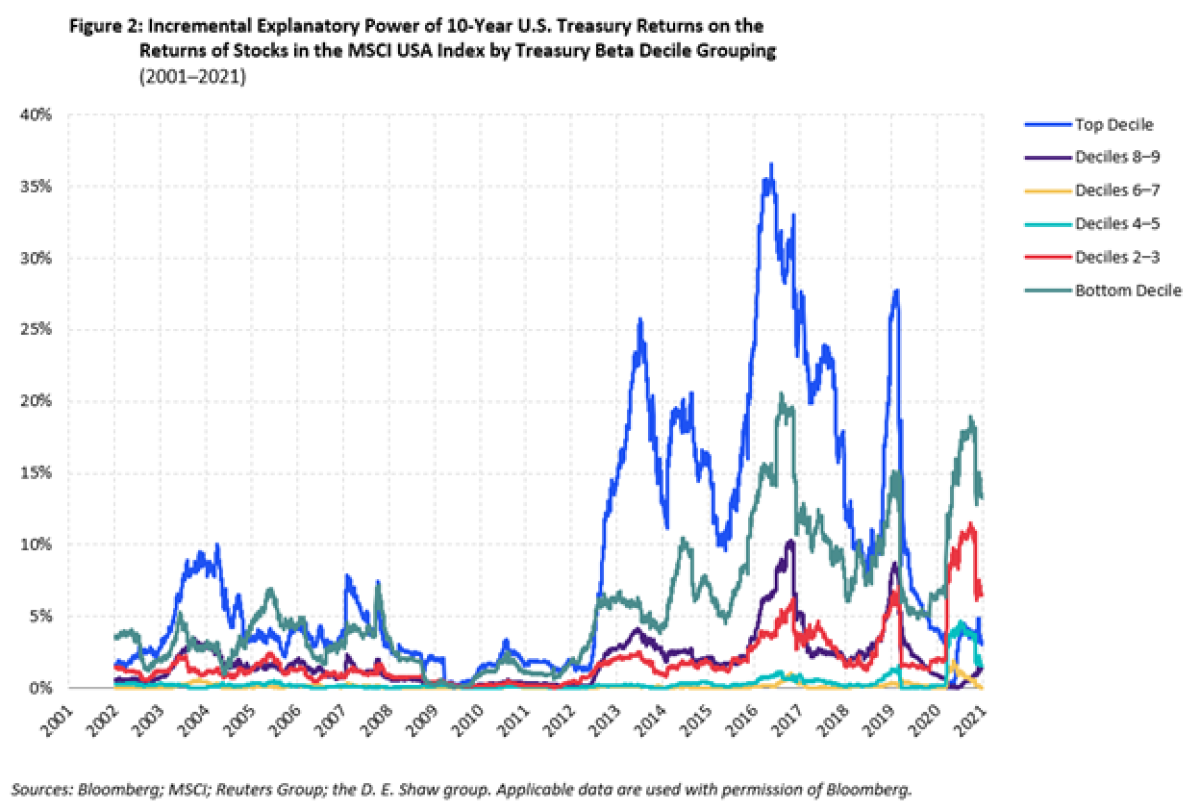
We see that interest rate sensitivities exhibit increased dispersion, particularly at the top and bottom of the distribution, starting around 2012. Indeed, the interest rate sensitivities of stocks in the in the top and bottom deciles more than doubled relative to their pre-2012 levels for much of the last decade. Figure 2 plots the increase in R-squared, a measure of explanatory power over variations in outcome, resulting from the inclusion of 10-year Treasury returns as a second independent variable in a regression of each decile portfolio’s average return on the equity market return. In other words, this graph depicts the amount of decile return variation that can be explained over and above the impact of equity market beta alone by adding bond returns to the analysis.
Prior to 2012, for the top- and bottom-decile portfolios, the explanatory power gained from including Treasury returns in the analysis averaged 3.4% and 2.7%, respectively. Over the subsequent decade, those figures increased three- to four-fold, to 13.5% and 8.2%, respectively.
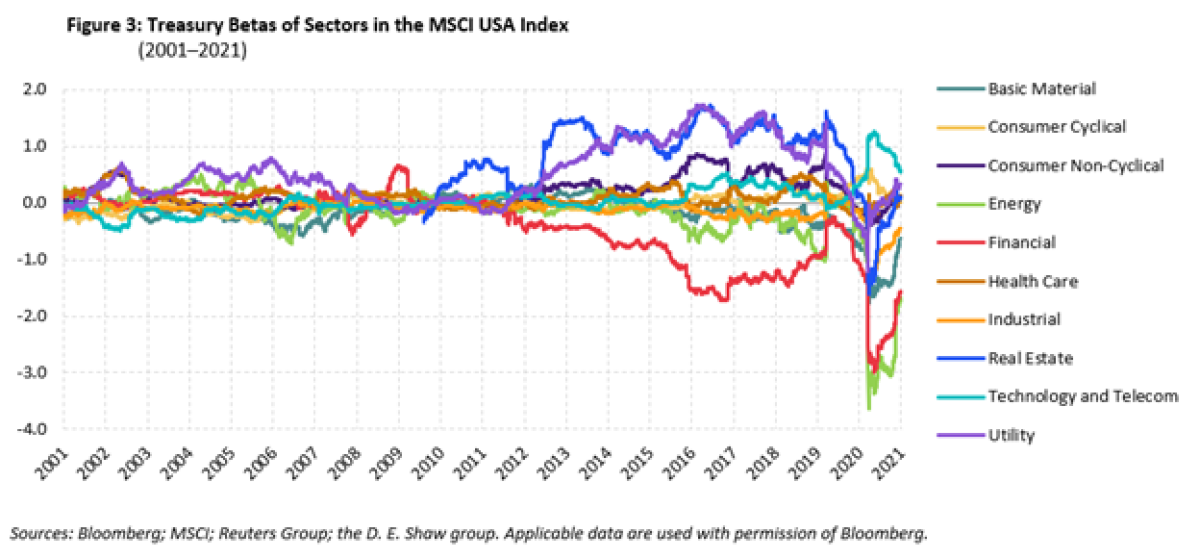
Similar to what we observe with respect to single stocks, we also see increased dispersion in interest rate sensitivities when our focus moves to equity sectors and style factors, as shown in Figures 3 and 4, respectively. Each graph depicts the impact of Treasury returns on sector or style factor returns after accounting for equity market beta.
Treasury beta dispersion across sectors and style factors was muted until about 2012 but grew substantially in the decade that followed. Although there is some time variation, the financial and energy sectors generally exhibited negative Treasury betas (underperforming when interest rates fell), while utilities and real estate exhibited mostly positive Treasury betas. Most recently, from the onset of the COVID-19 pandemic, technology stocks—often viewed as long-duration assets with expected cashflows far in the future—experienced the highest Treasury betas among sectors.
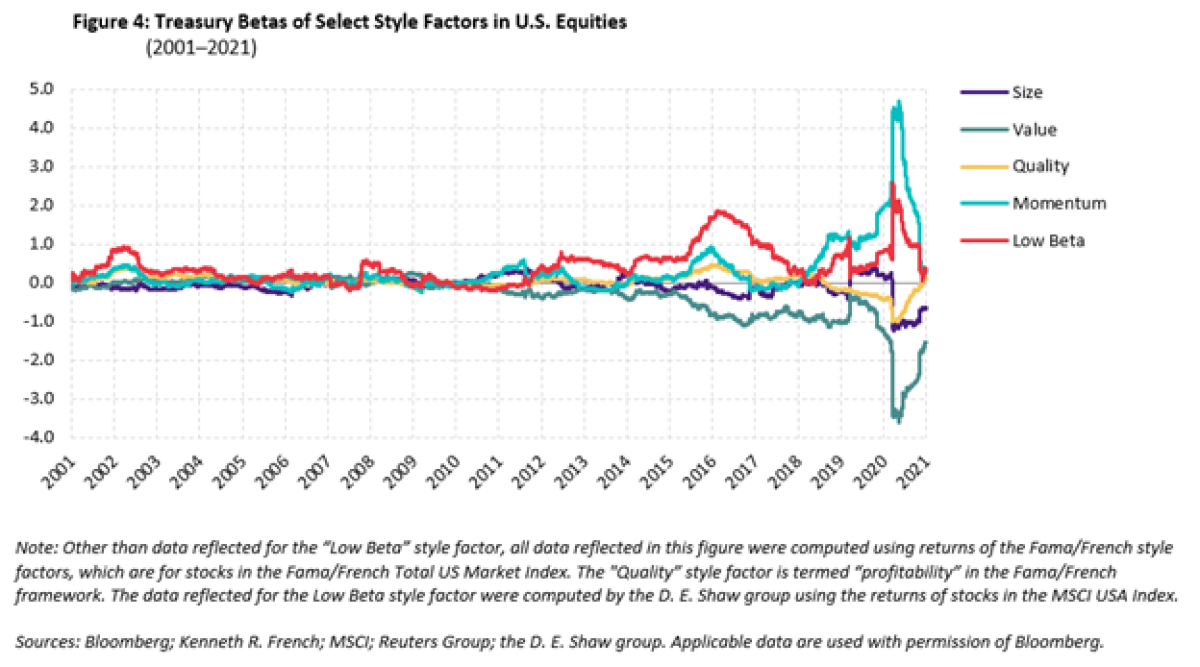
Among style factors, returns to the value factor had negative excess sensitivities to Treasury returns over the past decade after exhibiting only minimal such sensitivities in the decade prior. This suggests that investors may wish to consider, as a matter of risk management, the relationship between factor returns and interest rate movements when explicitly investing in factor-tilt portfolios or in strategies that may have unintentional factor or style biases.
Measuring the Impact on Performance
While increased dispersion in interest rate sensitivities across sectors and styles highlights the importance of stock-bond correlation in the cross- section of U.S. stock market returns, investors rarely seek exposure to sectors or style factors in their pure form (e.g., through portfolios comprising 100% long/short exposure to value or 100% financial stocks). This raises the following question: How have “investable” portfolios been affected by this increased dispersion?
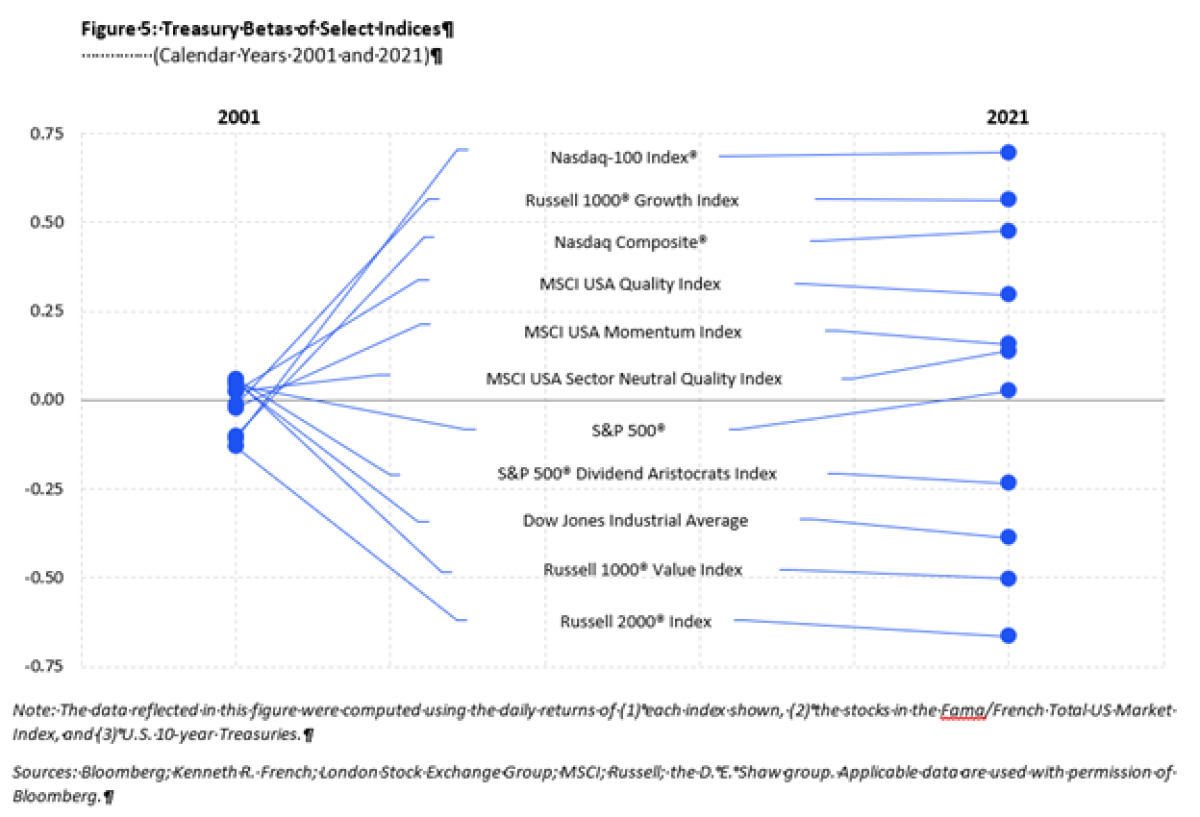
To address that question, we computed Treasury betas for select investable indices, using the broad universe of U.S. stocks constituting the Fama/French Total US Market Index to compute equity market beta. Figure 5 presents Treasury betas for two periods 20 years apart.
Consistent with our other findings, Treasury betas for these investable indices experienced a large increase in dispersion between the two periods. The approximate spread in Treasury betas among these indices jumped from 0.20 (-0.15 to 0.05) to more than 1.35 (-0.65to 0.70).
The magnitude of these differences is economically meaningful. A Treasury beta of 0.70, for example, suggests that if the 10-year Treasury note returns -5% because of interest rate changes (a slightly less than one standard deviation move on an annualized basis over the 2001–2021 period), the relevant index would underperform its equity market beta by 3.5%.
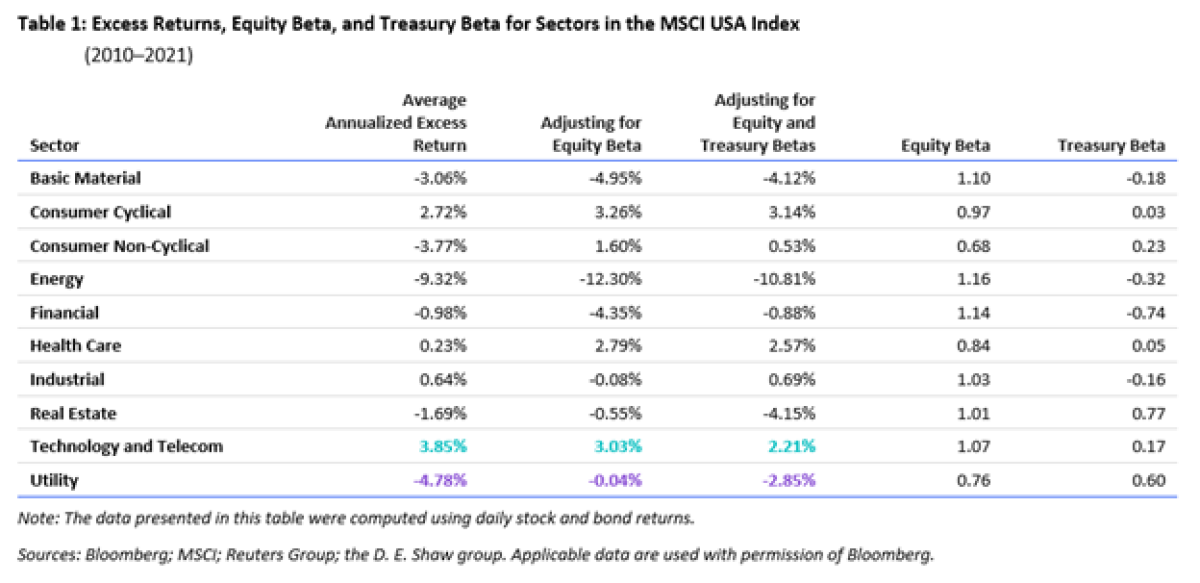
At a more granular level, this trend also has implications for performance attribution. Investors often equity beta-adjust sector returns when considering sector-specific investments. Given the increased dispersion in interest rate sensitivities, it is instructive to consider how sector returns are affected when adjusting for equity and Treasury betas over the past dozen years. The performance presented for the technology and utilities sectors in Table 1 stands out in that respect.
The excess return of the technology sector is pared down considerably after adjusting for its equity market beta, and further still when adjusting for Treasury beta. Although technology was the top-performing sector over the period on an unadjusted basis, it falls to third after accounting for those betas. The utility sector return, by contrast, receives a substantial boost when adjusting for equity beta, but more than half of that gain dissipates after adjusting for Treasury beta.
A Closer Look at Rate Sensitivities Dispersion
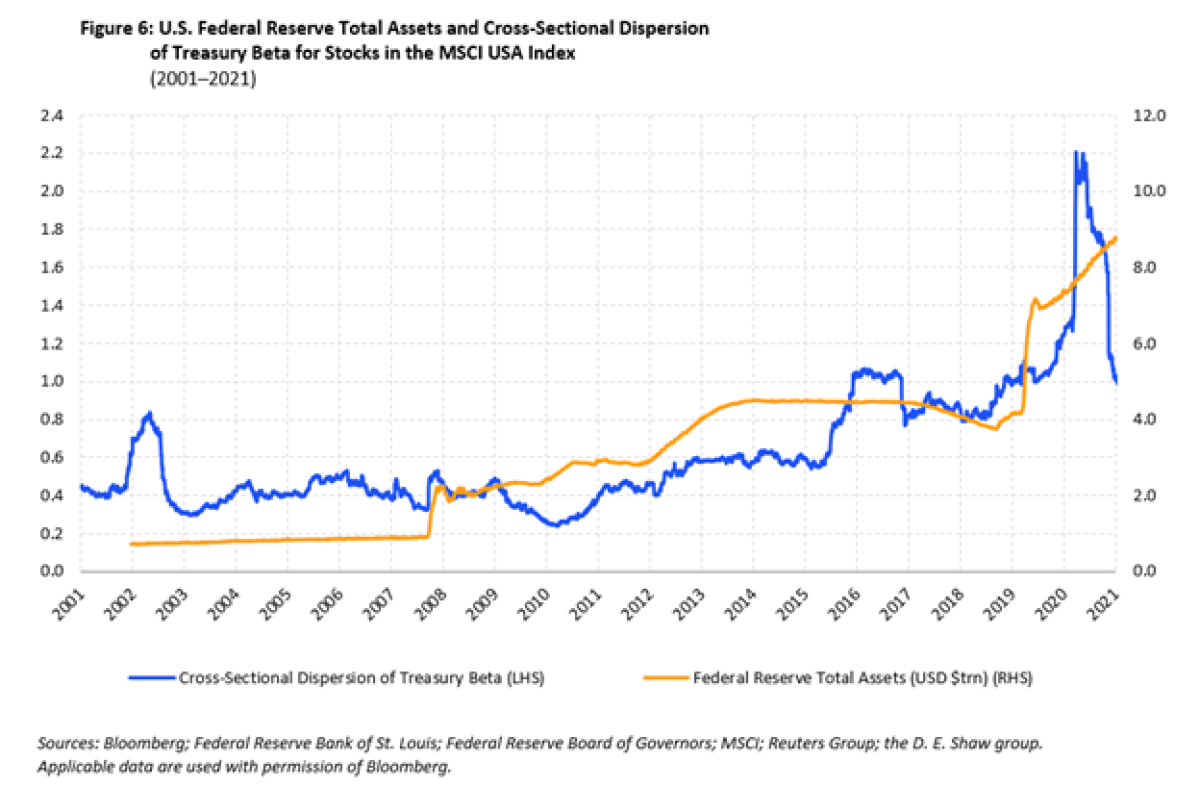
What accounts for this increased dispersion in the interest rate sensitivities of U.S. stocks? We considered a number of explanations and, although none struck us as incontrovertible or all-encompassing, we offer here a conjecture related to the interest rate environment that we believe is intuitively appealing. The beginning of the growth in dispersion coincided with the U.S. Federal Reserve’s efforts to expand its balance sheet and manage yield curves beyond the traditionally targeted short end of the curve. The Fed’s initiatives helped drive interest rates lower, and central banks in Japan and Europe pursued similar policies.[1] Figure 6 overlays the Fed’s growing balance sheet on the cross-sectional dispersion in Treasury betas, measured as the standard deviation of Treasury betas across stocks each day.
Central bank policy may have incentivized investors to begin assessing equities through a lens of “bond-likeness” and to more closely scrutinize what they may view as “bond-equivalent” equities. The extent to which a stock’s characteristics resemble those of government bonds might matter more for equity pricing than it did in the past, increasing the importance of interest rate sensitivities in the analysis of stock returns.
If monetary policy contributed to this trend of diverging interest rate sensitivities across equities, should we expect sensitivities to reconverge if and when monetary policy normalizes? In our view, the answer may be “no.” Once awoken to interest rate sensitivity, investors may continue to consider it a key factor in equity pricing, in much the same way that the size-value style box became entrenched in stock analysis during the 1990s.
Finally, it is important to keep in mind that monetary policy is only one among several factors that may have contributed to the dispersion in interest rate sensitivities over the past decade. Other potential drivers include industry-specific developments, such as changes in funding conditions for financial companies; a period of relatively low equity market volatility; dispersion in relative valuations across equities; and changes in the capital structure and payout behavior of companies.
Conclusion
There isn’t just one uniform “stock-bond correlation” across U.S. equities. Over the past decade, U.S. equities exhibited increased variation in their sensitivities to interest rate movements at each of the individual stock, sector, and style factor levels. Consequently, we believe that sector and style factor portfolios, as well as many commercial equity benchmarks, may have more active exposure to interest rates than many investors appreciate.
Increased dispersion of interest rate sensitivities across equities highlights the importance of rigorous, dynamic risk management in portfolio construction and robust performance evaluation in investment decision making. At the same time, it could provide opportunities for investors looking to actively manage the exposure of their equities to Treasuries. With interest rate shifts already underway from the U.S. Federal Reserve and other central banks, we believe that stock-bond sensitivities merit a closer look in the near term and years ahead.
Appendix
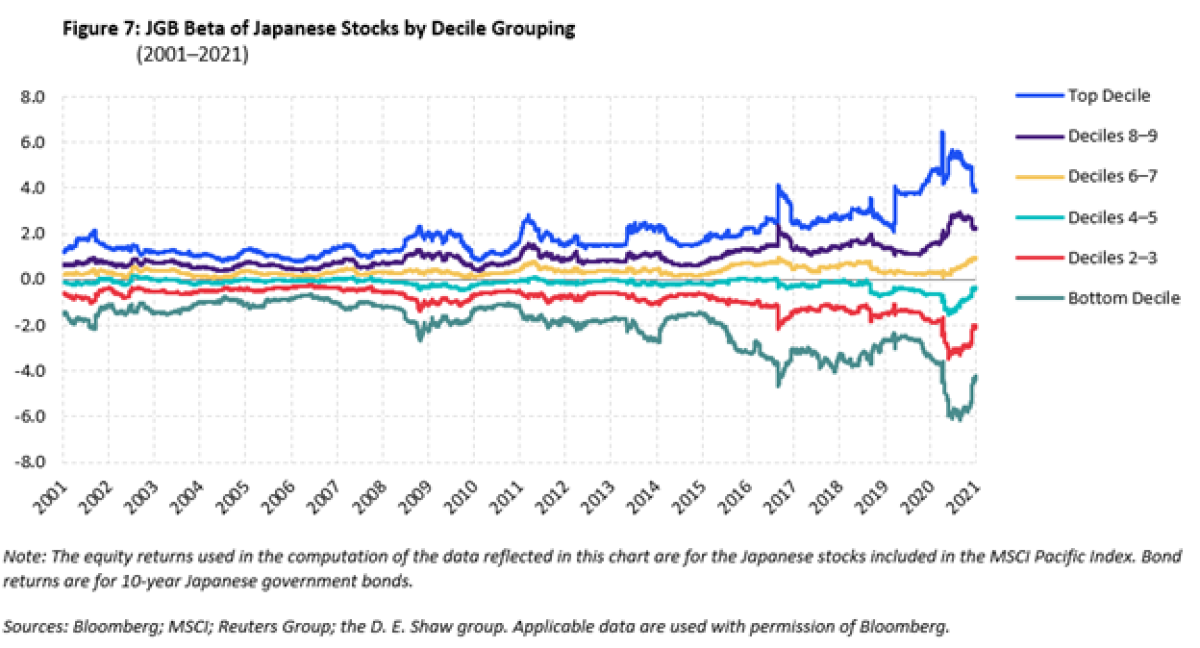
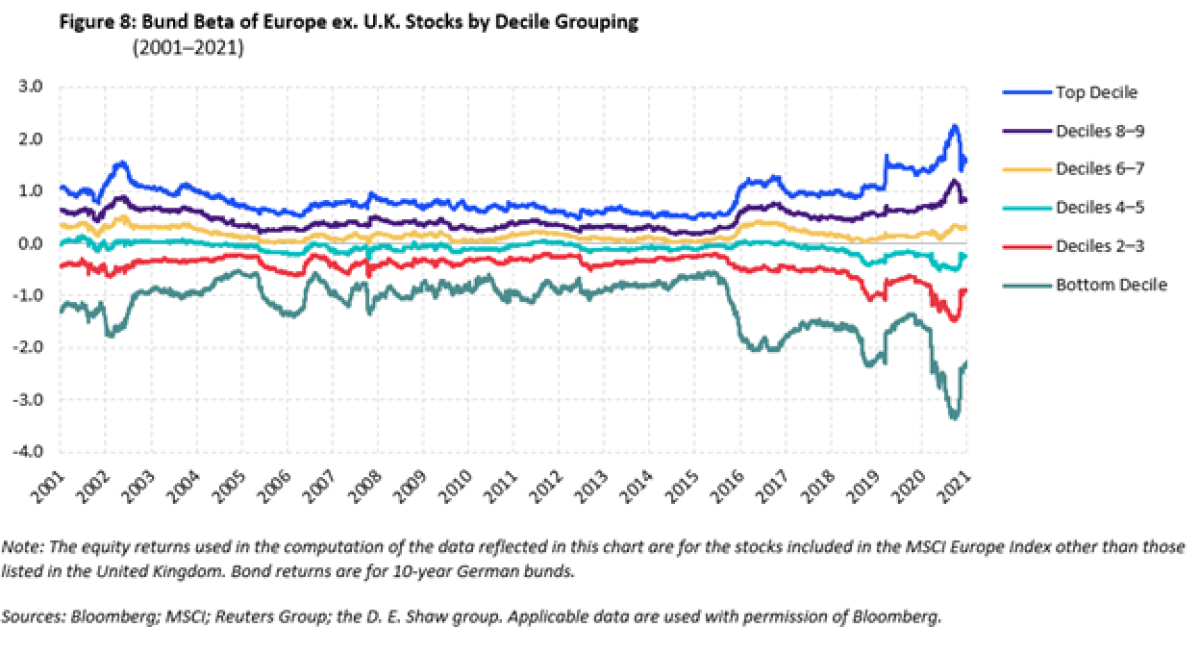
Our findings indicate that increased dispersion in interest rate sensitivities over the past decade has not been limited to U.S. stocks. As depicted in the following two figures, we observe similar trends in the Japanese and European equity markets.
Link to D.E. Shaw's origin story
THIS DOCUMENT IS PROVIDED TO YOU FOR INFORMATIONAL PURPOSES ONLY AND DOES NOT CONSTITUTE INVESTMENT ADVICE OR AN OFFER TO SELL (OR THE SOLICITATION OF AN OFFER TO BUY) ANY SECURITY, INVESTMENT PRODUCT, OR SERVICE. THE VIEWS EXPRESSED IN THIS DOCUMENT ARE SOLELY THOSE OF THE D. E. SHAW GROUP AS OF THE DATE OF THIS DOCUMENT, ARE SUBJECT TO CHANGE WITHOUT NOTICE, AND MAY NOT REFLECT THE CRITERIA EMPLOYED BY ANY PERSON OR ENTITY IN THE D. E. SHAW GROUP TO EVALUATE INVESTMENTS OR INVESTMENT STRATEGIES. SIMILARLY, THE INFORMATION CONTAINED IN THIS DOCUMENT IS PRESENTED SOLELY WITH RESPECT TO THE DATE OF THIS DOCUMENT (UNLESS OTHERWISE INDICATED) AND MAY BE CHANGED OR UPDATED AT ANY TIME WITHOUT NOTICE TO ANY OF THE RECIPIENTS OF THIS DOCUMENT. THE INFORMATION CONTAINED IN THIS DOCUMENT HAS BEEN DEVELOPED BY THE D. E. SHAW GROUP AND/OR OBTAINED FROM SOURCES BELIEVED TO BE RELIABLE; HOWEVER, THE D. E. SHAW GROUP DOES NOT GUARANTEE THE ACCURACY, ADEQUACY, OR COMPLETENESS OF SUCH INFORMATION. FURTHER, THIS DOCUMENT CONTAINS PROJECTIONS AND OTHER FORWARD-LOOKING STATEMENTS REGARDING FUTURE EVENTS, TARGETS, OR EXPECTATIONS. SUCH STATEMENTS ARE BASED IN PART ON CURRENT MARKET CONDITIONS, WHICH WILL FLUCTUATE AND MAY BE SUPERSEDED BY SUBSEQUENT MARKET EVENTS OR OTHER FACTORS. HISTORICAL MARKET TRENDS ARE NOT RELIABLE INDICATORS OF FUTURE MARKET BEHAVIOR OR THE FUTURE PERFORMANCE OF ANY PARTICULAR INVESTMENT AND SHOULD NOT BE RELIED UPON AS SUCH.MORE GENERALLY, NO ASSURANCES CAN BE GIVEN THAT ANY AIMS, ASSUMPTIONS, EXPECTATIONS, AND/OR OBJECTIVES DESCRIBED IN THIS DOCUMENT WILL BE REALIZED. NONE OF THE ENTITIES IN THE D. E. SHAW GROUP; NOR ANY OF THEIR RESPECTIVE AFFILIATES; NOR ANY SHAREHOLDERS, PARTNERS, MEMBERS, MANAGERS, DIRECTORS, PRINCIPALS, PERSONNEL, TRUSTEES, OR AGENTS OF ANY OF THE FOREGOING SHALL BE LIABLE FOR ANY ERRORS (AS A RESULT OF NEGLIGENCE OR OTHERWISE, TO THE FULLEST EXTENT PERMITTED BY LAW IN THE ABSENCE OF FRAUD) IN THE PRODUCTION OR CONTENTS OF THIS DOCUMENT, OR FOR THE CONSEQUENCES OF RELYING ON SUCH CONTENTS. NEITHER THIS DOCUMENT NOR ANY PART OF THIS DOCUMENT MAY BE REPRODUCED OR DISTRIBUTED WITHOUT THE PRIOR WRITTEN AUTHORIZATION OF THE D. E. SHAW GROUP.
COPYRIGHT © 2022 D. E. SHAW & CO., L.P. ALL RIGHTS RESERVED.