


By Ehab Hosny, CFA, FRM, CAIA, Research Manager; Brendan Fludder, CFA, Research Manager; and Noah Comen, CFA, Investment Strategy Analyst at Wellington Management.
There has been a lot of innovation in asset allocation and portfolio construction over the years, including efforts to enhance diversification without sacrificing returns. Fixed income portfolios have been a particular area of focus, with market headwinds and allocators’ shifting objectives driving interest in the use of hedge funds as a partial substitute for traditional fixed income allocations.
A common solution has been to build a multi-manager hedge fund portfolio with bond-like volatility and minimal correlation to equities. But we see pitfalls in this approach. For example, volatility and correlation levels are often conditional on the market regime, and therefore unstable and unreliable when targeting a specific outcome. In addition, allocators constructing such a portfolio often focus on how to weight various categories of hedge fund strategies (e.g., Macro and Relative Value) in order to navigate certain market environments. But we have found that the behavioral profiles of hedge fund categories have been more similar than not in recent years, suggesting that a portfolio structured in this way may be less diversified than it appears.
In this paper, we propose an alternative approach for analyzing hedge funds and constructing multi-manager hedge fund portfolios intended to stand in for fixed income. As factor-based manager researchers and allocators, we believe a style-factor lens can help allocators understand the biases of their managers and define the desired roles of their investments. Here we use that lens to help capture the roles of a fixed income allocation and build portfolios of hedge funds that are more connected to those roles and the desired outcome. Among our key conclusions:
• A role-based framework can help better align manager research, portfolio construction, and potential investment outcomes.
• Decisions about allocations to individual hedge funds can have a greater impact on the role and behavioral profile of a multi-manager portfolio than decisions about how to weight different hedge fund categories.
• As a result of the unconstrained nature of hedge funds and the tool kit at their disposal, they can potentially be used to build targeted outcome-oriented solutions such as a fixed income substitute portfolio designed for different interest-rate environments.
What is fixed income’s role — and can it get the job done?
In CIO offices around the world, allocators are asking questions about whether fixed income can continue to reliably fill certain roles, including those commonly played by interest-rate and credit spread allocations, in different market environments. At the risk of a very US-centric reference, it brings to mind the words of Bill Belichick, a well-known coach in American football, who famously reminds his players that success relies on their willingness to play their role — or as he puts it, “Do your job!” This is our mindset when managing client solutions. We start by asking what role the allocation is intended to fill.
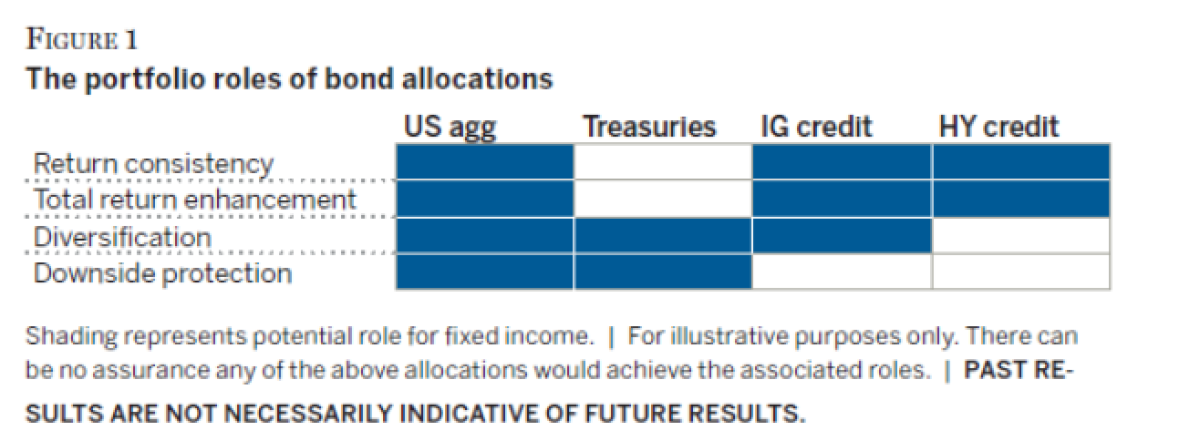
To bring this to life, Figure 1 distills the many use cases for fixed income into four high-level roles and highlights the corresponding segments of the fixed income market that have historically been used to fulfill them. For example, “return consistency” is naturally aligned with a yield-focused mix of assets that may offer stable and consistent spread or carry-oriented pickup while “downside protection” requires countercyclical exposure most sought after when risk assets, such as equities, are out of favor.
While we think fixed income continues to warrant a seat at the asset allocation table, the search for complementary or even substitute allocations is warranted given that investors have been confronting some of the most challenging bond market conditions in their careers. Although the global market picture has changed significantly since the beginning of 2022, there was evidence at that point of record-high exposure to interest-rate sensitivity paired with record-low outright yields (Figure 2).
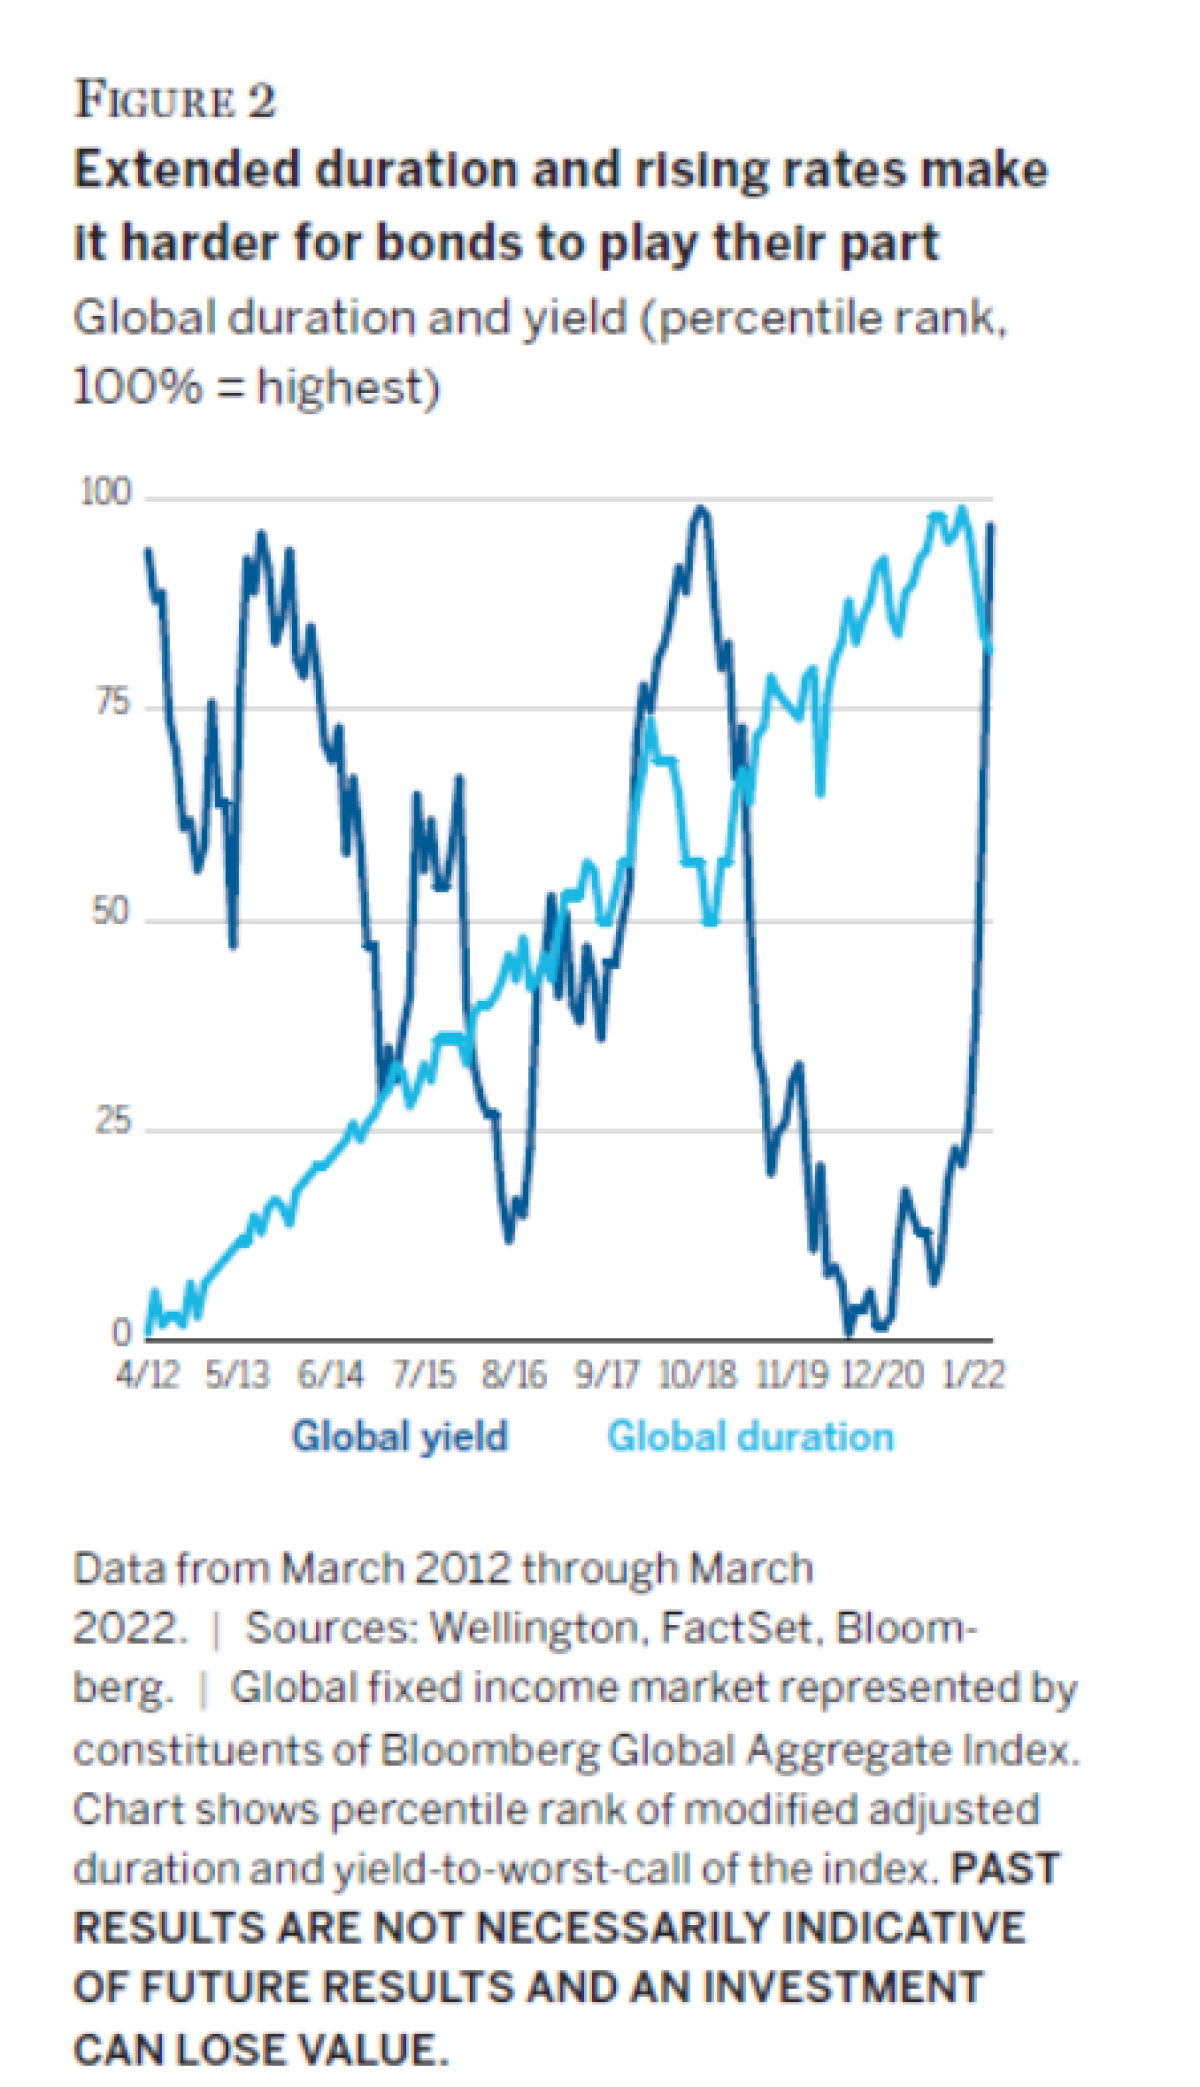
This market setup created arguably limited prospects for future diversification and downside protection potential in both rising and declining interest-rate environments, leaving many scratching their heads when trying to effectively source these two very important portfolio roles. Looking at traditional high-quality global bond benchmarks, the steady and incremental increase in duration extension has been quietly exposing allocators to some of the highest interest-rate sensitivity in recent history.
Turning more specifically to the US market, the combination of record-high duration, record-low yield cushion, and elevated interest-rate volatility has brought about a more muted downside protection profile for US Treasuries during periods of equity market weakness. Using our market environments model, Figure 3 shows that over the last 10 years (dark blue bars), US Treasuries returned 0.21% during weeks when the S&P 500 Index had a negative return (Equity Lagging). And in the most extreme negative environments for equities (Equity Left-Tail), Treasuries returned an even stronger 0.33% on average. Over the last two years, however, there has been a striking decline in downside protection from US Treasuries in both of the equity environments, for the reasons articulated above.
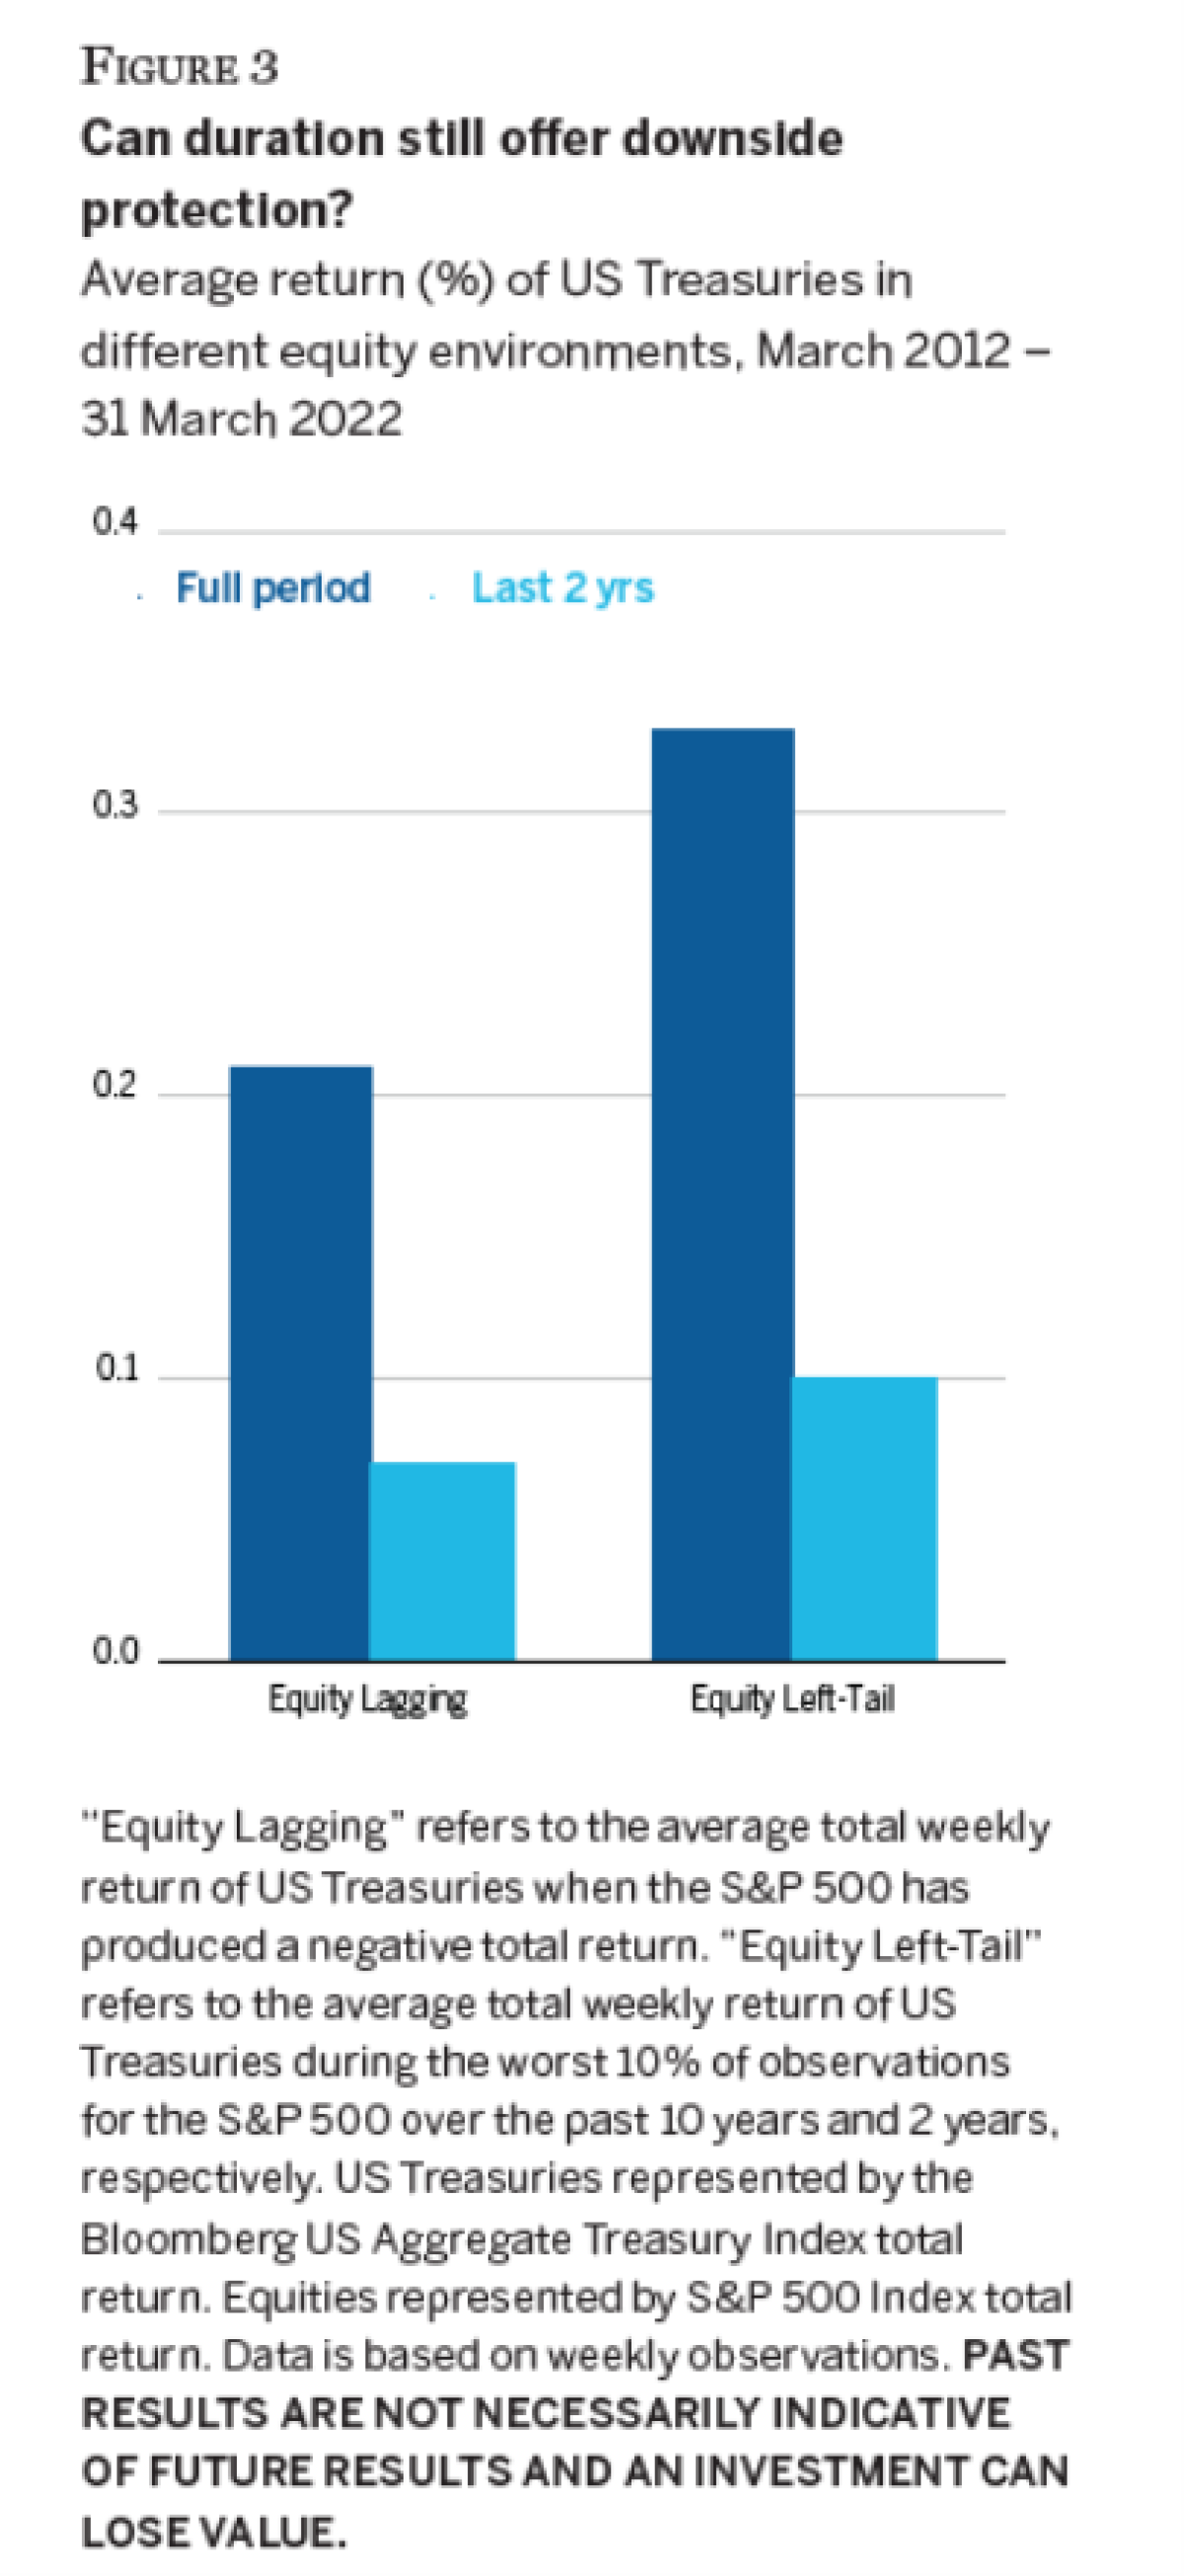
It is worth noting that equities returned -3.32% and -3.76% in the Equity Left-Tail full period and the last two years, respectively.
Where do hedge funds fit in?
We are by no means suggesting that bond allocations go to zero in portfolios. Our view is simply that there can be times when an allocator seeks to offset specific types of exposures within a multi-asset portfolio and that a role-based mindset can help bring structure to the process.
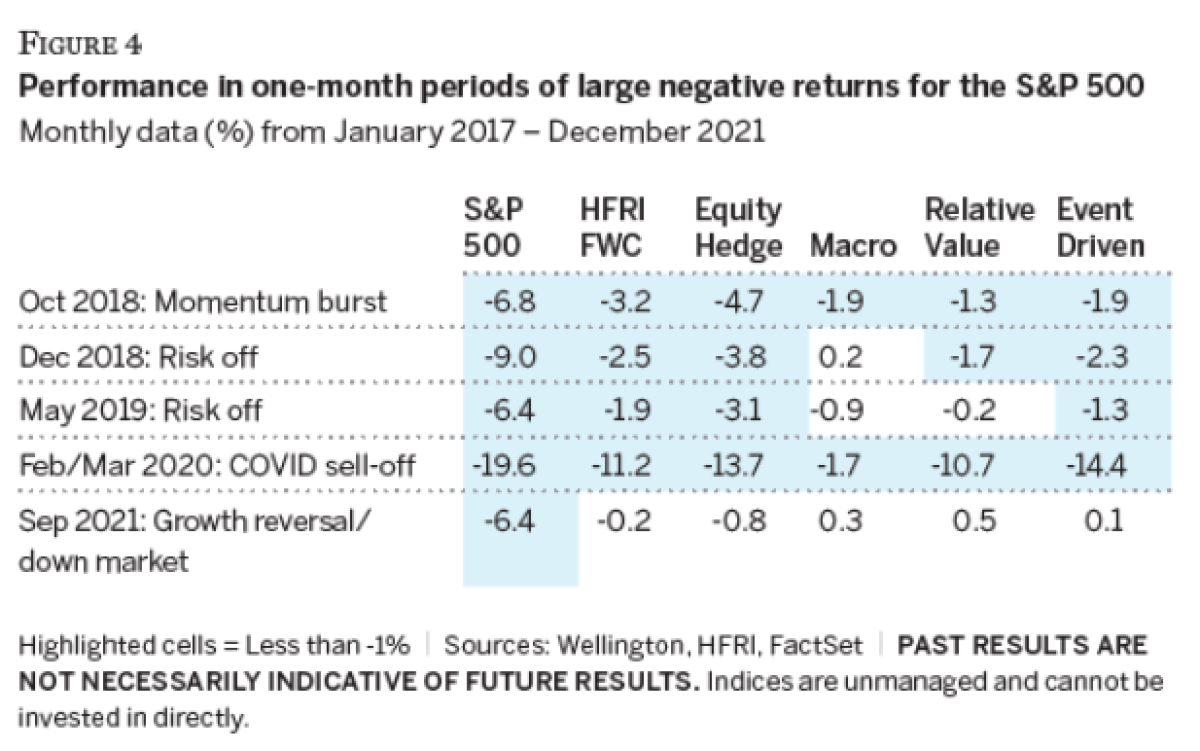
If hedge funds are the portfolio tool of choice, then we need to also assess the roles and behaviors of a hedge fund’s components, and here we believe views are evolving. For example, we think many allocators no longer expect a portfolio of hedge funds that has broad exposure to all of the main strategy groups to realistically generate consistent positive absolute returns during equity market downturns. The directional market exposure in most Equity Hedge strategies and many Event Driven strategies and the conditional correlation to risk sell-offs often observed in fixed income-oriented Relative Value strategies may, in aggregate, tend to overwhelm diversification properties that Macro strategies could offer in stressed market conditions.
To illustrate this point, Figure 4 shows returns of the HFRI Fund Weighted Composite (FWC) Index and the four main HFRI strategy groups for periods involving US equity market sell-offs and/or factor rotations during the five years ended 31 December 2021. While some HFRI strategy groups occasionally displayed capital preservation properties in challenging environments, the broad HFRI FWC Index tended to exhibit meaningful downside participation.
For the purposes of comparing hedge funds to fixed income, we applied the same role-based lens we used for fixed income to the hedge fund universe, as shown in Figure 5. We mapped the fixed income roles from Figure 1 to the four main HFRI hedge fund strategy groups and the broad hedge fund industry (proxied by the HFRI FWC Index). While there is certainly a wider range of strategy types in practice, we believe this view avoids unnecessary complexity related to index composition and reflects the way in which most allocators expect hedge funds to behave.
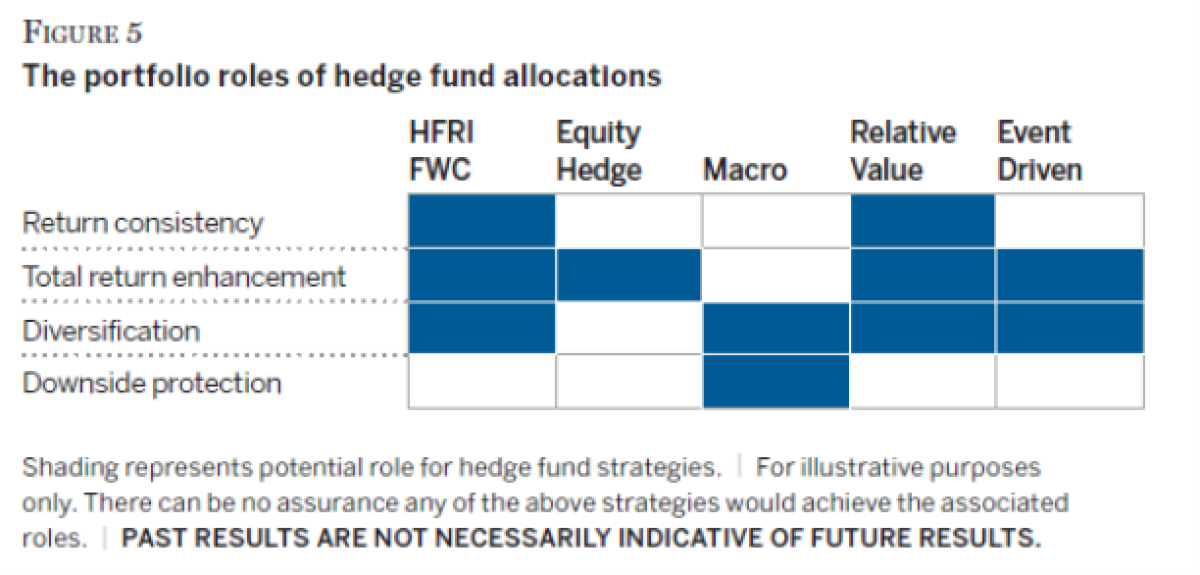
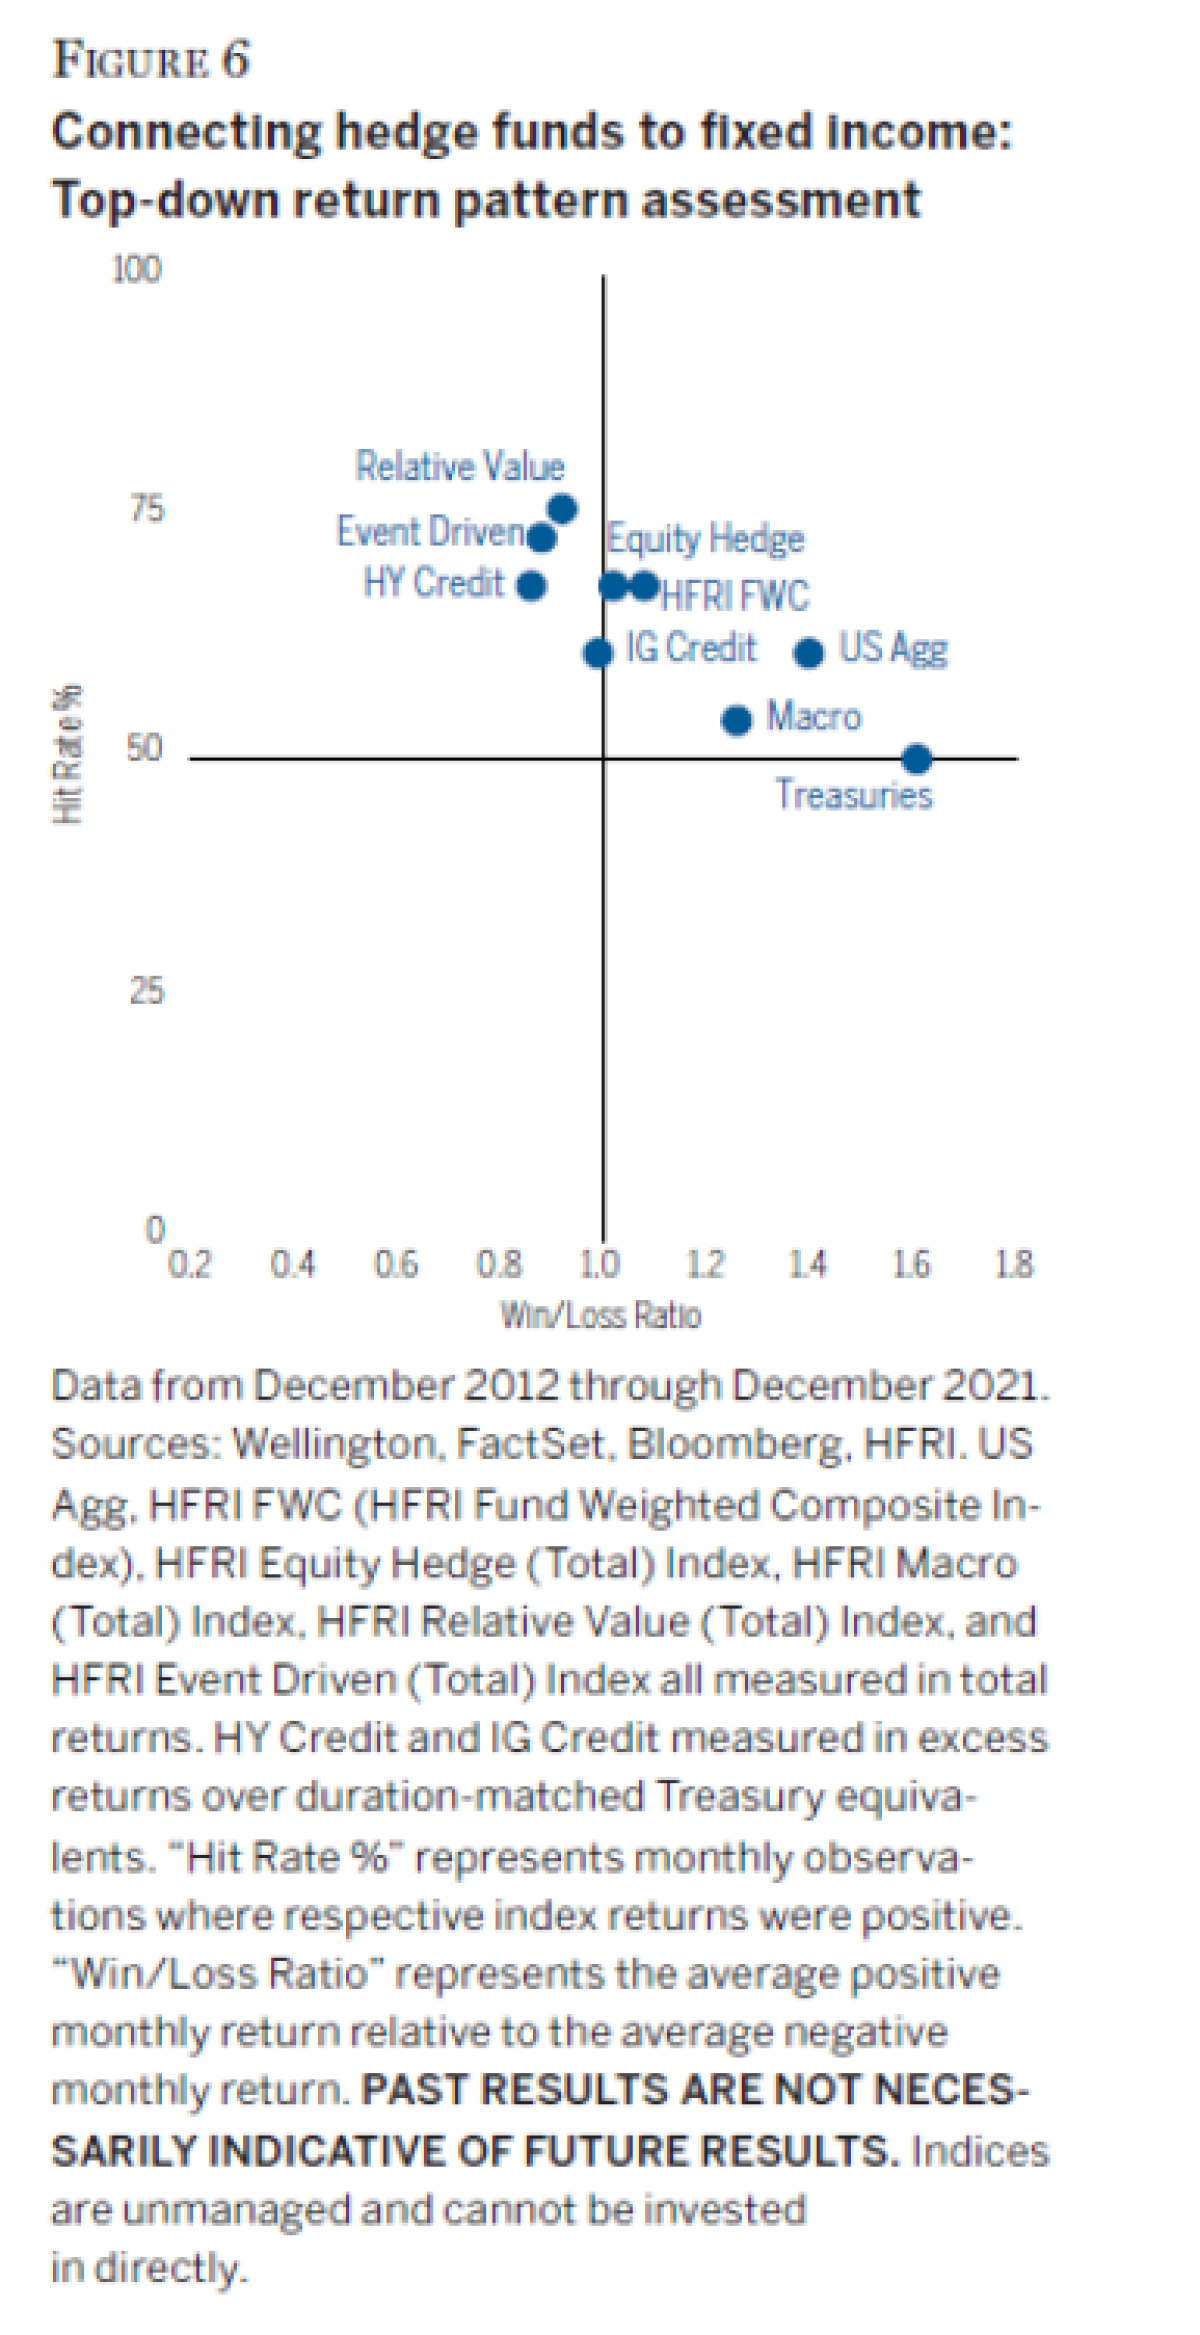
To address the four fixed income roles, we think a naïve allocation to the broad hedge fund universe (i.e., HFRI FWC) will not suffice and a more targeted approach is needed. To help us illustrate some of the similarities and differences in the return patterns of fixed income markets and hedge funds, we used our “Hit Rate %” and “Win/Loss Ratio” metrics to look at fixed income and hedge fund performance during the 10 years ended 31 December 2021 (Figure 6). Hit Rate % represents the percentage of monthly observations in which returns were positive, while Win/Loss Ratio measures the magnitude of the average positive return (“wins”) relative to the average negative return (“losses”). We find returns can be generated either through high consistency (Hit Rate %) and/or favorable asymmetry (Win/Loss Ratio). Said differently, you can win over the long run by being right often or by winning big less frequently while minimizing the magnitude of the losses. We find these two measures helpful and complementary when considering the pattern of returns generated. For example, it is striking that high-yield credit, Relative Value hedge funds, and Event Driven hedge funds generated some of the most consistent return profiles during the last decade. On the other hand, allocations generally thought to be well-suited for diversification and downside protection, namely Treasuries and Macro hedge funds, were among the least-consistent return generators but were on the higher end of the Win/Loss Ratio spectrum. Overall, this simplistic view suggests that there have been some similarities in the return patterns, at least on the surface.
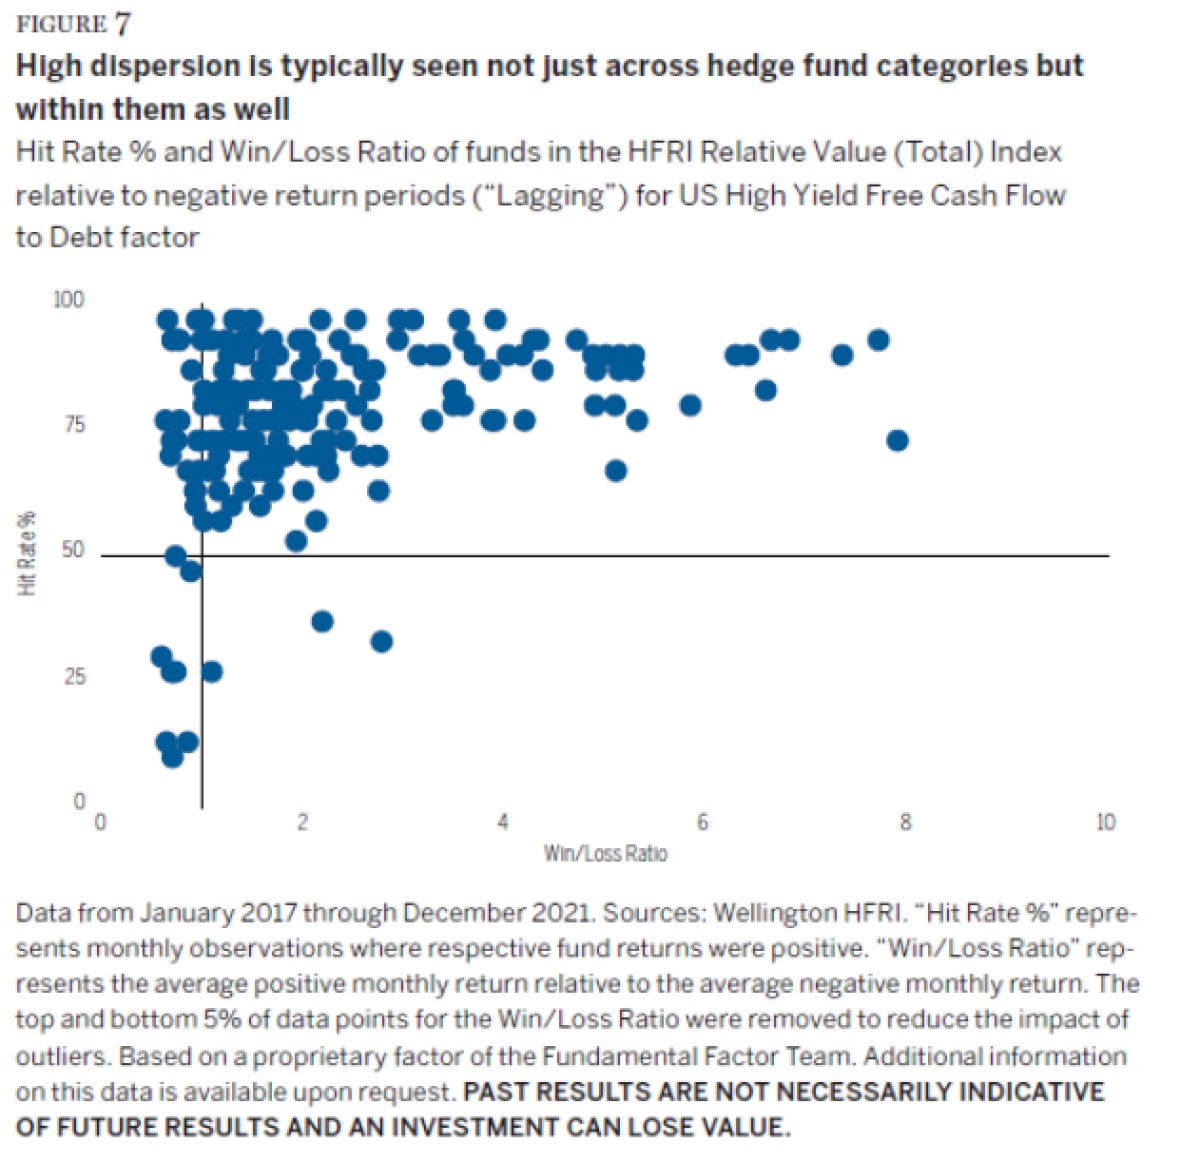
We also cannot ignore the historically high level of performance dispersion across individual managers, even within the same hedge fund strategy groups. Figure 7 presents one way to think about high dispersion across managers in relation to one of our fundamental factors (we provide an overview of our factor framework in the next section). We used the Hit Rate % and Win/Loss Ratio metrics to illustrate the historical relationship of Relative Value funds to periods of negative returns in one of our Risk Aversion factors in US high-yield credit. The chart suggests that many Relative Value managers performed well (high Hit Rate % and Win/Loss Ratio) in challenging periods for risk aversion (i.e., short exposure to risk aversion). However, while many funds were in that top-right quadrant, there was clearly a meaningful amount of dispersion.
Taking all of this into account, we believe a behavioral assessment of individual managers’ return profiles, using fundamental factors, offers a more nuanced and effective method of determining the role of funds and building targeted, outcome-oriented portfolios of hedge funds.
Applying our factor framework to hedge fund allocations
We find the use of the word “factor” gets a wide range of responses from clients and sometimes makes allocators cringe. We believe our approach helps make the concept a little more digestible as one of our core beliefs is that factors need to be tied to a fundamental picture, not only in the interpretation of the results but, equally importantly, in the factor construction itself.
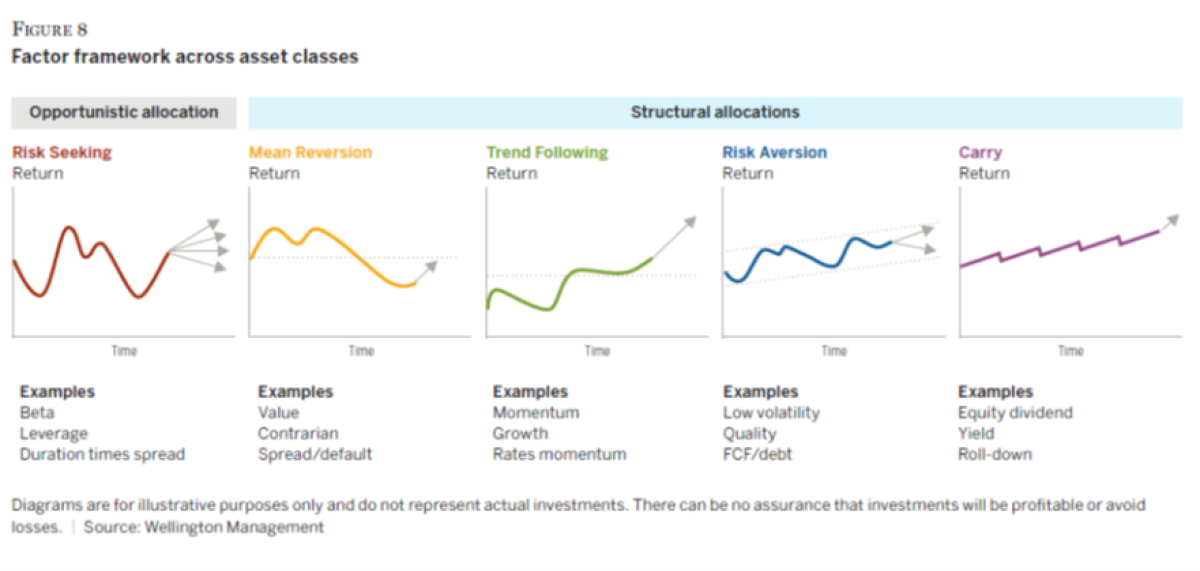
As members of Wellington’s Fundamental Factor Team, we use a nuanced “role-based” framework the team has developed to help understand the pattern of portfolio managers’ alpha behavior across a variety of style factor categories. These factors fall into five broad categories, which can be applied to each of the main asset classes and are based on their potential portfolio role and behavior:
Risk Seeking — High risk, wide range of outcomes, levered to the cycle
Mean Reversion — Capital appreciation, believe current discount will revert to the mean
Trend Following — Capital appreciation, believe current trend will continue beyond the mean
Risk Aversion — Capital compounder, low risk, countercyclical defensive allocation
Carry — Income, consistency, current income more important than capital appreciation
All of our proprietary factor development and manager assessment work follows this broad “Behavioral Classification System.” Figure 8 shows how we visualize each of these factor categories and some common examples.
We believe these style-oriented factor categories are naturally diversifying to each other and can support allocation decision making within and across asset classes. For example, in the first five months of 2022, there was little room for allocators to benefit from traditional asset class diversification across areas such as equities, rates, and credit. But an allocation to Risk Aversion and Mean Reversion factors in equities and credit would have performed well in comparison to an allocation to Risk Seeking factors. Trend Following factors were another bright spot during this period.
Aligning manager research and portfolio construction to the same framework in this way may help drive better outcomes, allowing for a tighter connection between the bottom-up and top-down aspects of these processes. While this approach does not ensure that allocators will avoid exposures that markets simply do not reward, it should help reduce the risk that the role of an allocation in a portfolio ends up being materially different than what was intended.
Using this framework, we will do the following:
1. Evaluate which of the factors described above may best fill the roles of a traditional fixed income allocation outlined in Figure 1. We will consider this question in the context of market environments that involve large moves in nominal interest rates (up and down).
2. Use our framework to identify which hedge funds have had a tilt to these factors over time.
3. Construct hypothetical diversified portfolios of hedge funds that have behavioral profiles that map well to the desired roles of fixed income in different interest rate environments.
Importantly, these hypothetical portfolios are designed purely on the basis of analytics, without any qualitative assessment of the underlying managers other than knowing the strategy groups to which they belong. We do not recommend this approach in practice, however. We believe a strong qualitative understanding of the underlying managers is required, with the analytics serving as a powerful tool in an iterative process that can help distinguish between repeatable behavior and noise, and potentially lead to a stronger understanding of the role strategies can play and more robust portfolio construction.
Finding factors that fit the roles of fixed income
Given the nonlinear profile we often see with factors, strategies, and asset classes, we evaluated the behavior of the factors in different rates market environments by analyzing performance in the tails. Due to the structurally declining rate environment of the last few decades, we used weekly data to ensure a sufficient number of data points for rising rate periods and to improve our confidence level in our interpretation of the data. We defined the extreme weekly moves in rates based on the absolute change in yield levels for nominal rates over the last 10 years and focused on the largest 5% of up and down weekly moves.
In Figure 9, we highlight the factors that were most effective in filling the four roles of fixed income allocations we identified earlier.
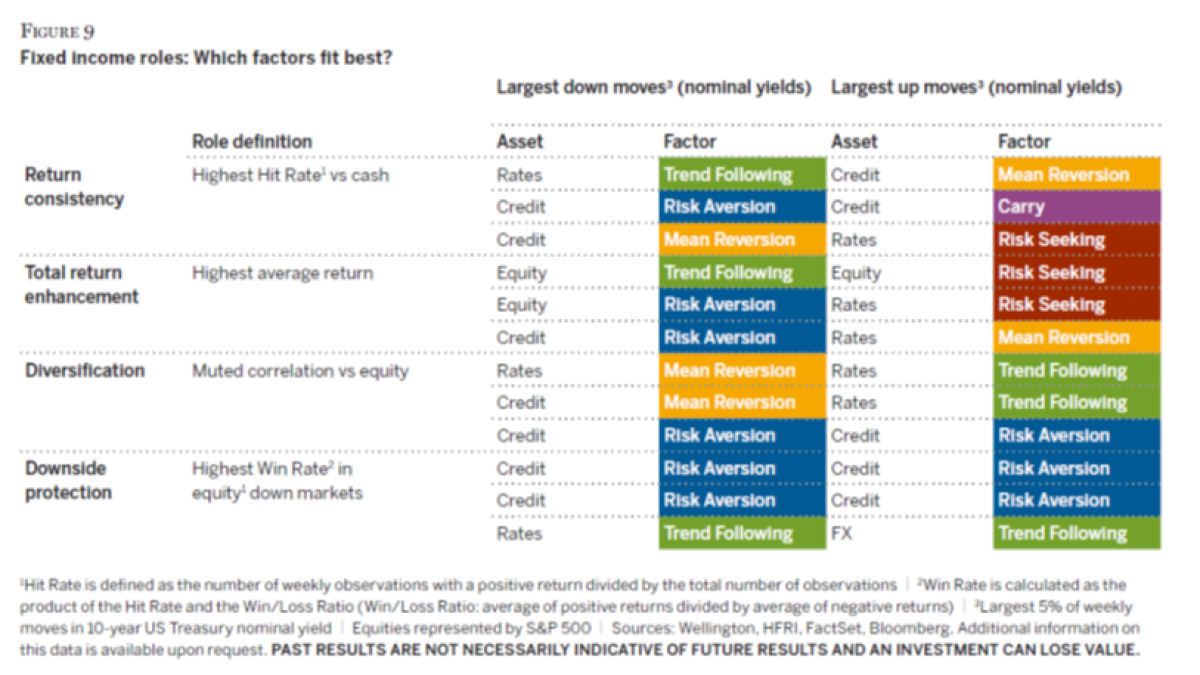
Our proprietary factor framework recognizes there is more than one stylistic expression within a given category. This helps us capture some of the subtle but still important differences in the behavioral profiles of various investment styles. For example, we have multiple ways of defining risk aversion in credit, such as Free Cash Flow to Debt and Low DTS (Duration Times Spread), both of which are included in the left-tail analysis below when attempting to fulfill a downside protection role.
As one would expect, the behavior of the factors varied significantly depending on the interest-rate environment. For example, while this level of detail is not presented in Figure 9, an investment-grade credit Carry factor (High Yield/Duration) had one of the highest Hit Rates in rising rate environments (98%) and one of the lowest Hit Rates in declining rate environments (4%).
Overall, the most important takeaway was that not only do top-level factor groups (e.g., Risk Seeking) matter for mapping the various roles in different rate regimes, but so do the individual factors within each group, as they capture different behaviors. This was not surprising, given that each factor seeks to identify securities with a specific set of fundamental traits. Among our other key observations:
• Risk Aversion factors were the most successful at providing downside protection across different interest-rate environments. They also generally played a bigger role in a declining rate environment, which is intuitive considering that large downward moves in rates have historically been associated with risk-off environments.
• Risk Seeking factors (in equities and rates), which tend to be more volatile and more cyclical, helped fill the role of total return enhancement in rising rate environments.
• Trend Following factors, which tend to be more reactive to market direction and have higher turnover, generally offered downside protection and diversification properties in periods of large moves in rates markets (up or down).
• A more diverse mix of factor groups was needed to fill the role of fixed income in periods of large upward moves in interest rates. This was likely due to the headwinds that rising rates tend to cause for many rates and credit factors.
It is worth noting that we repeated the analysis using real rates instead of nominal rates, since rate shocks driven by economic growth (as opposed to inflation) could lead to different behavior and impact the ability to perform the roles we outlined. However, the results were relatively similar and so we have not included them.
Hedge fund strategy groups from a bottom-up perspective
Having identified the factors that can potentially fill fixed income roles in specific rate environments, we analyzed the four main hedge fund strategy groups discussed earlier (Equity Hedge, Macro, Relative Value, Event Driven) to identify common factor profiles within each group. We would offer a few notes on this research before detailing the results:
• We believe the relationship of different funds to our fundamental factors is more persistent than the funds’ relationship to macro factors, as the latter tend to be more transient, unstable, and sometimes spurious. After all, hedge funds typically trade actively, with views on individual securities or markets often changing meaningfully. On the other hand, fundamental factors have a natural mechanism of filtering for securities with specific characteristics in a way that can be similar to what a manager does, potentially creating a better and more stable connection to a behavioral profile. For more detail on how our fundamental factors (as opposed to generic style or risk factors) help us map the investment philosophies and styles of individual managers, see our paper, “Factors as the language of manager research.”
• We think the granularity of our factor universe across regions (in equities, rates, credit, and currency) can capture some of the finer but important differences between various behavioral profiles and investment styles. This is why we decided to use factors to link managers to the behavior of individual securities as opposed to simply screening for managers who did well historically in rising or declining rate environments.
• In a purely analytics-driven exercise like this, there can be cases where random noise creeps into the results and the observed relationships are not explained by real causality. This issue may be magnified when evaluating funds that do not trade the same types of securities included in the behavioral factors (e.g., in the case of long/short equity funds that also trade some credit instruments). Still, we are comfortable with the results of our analysis for two reasons:
–– We applied the more relevant fundamental factors to the appropriate strategy groups; e.g., currency factors were only used in analyzing Macro strategies. This helped reduce the risk of having spurious relationships.
–– An outcome of our role-based framework and the way we group the factors is that the behavior of our factor categories is generally similar across equities and fixed income (e.g., Risk Aversion factors in both equity and credit have defensive properties and hence should be directionally similar even if the magnitude of their moves is different). This enabled us to have a more connected and holistic cross-asset view.
In short, we have taken the analytical imperfection of this exercise (after first restraining ourselves from trying to perfect it!) into consideration when interpreting the results and incorporating them into our views on portfolio construction.
Summarizing the findings for the hedge fund strategy groups
Figure 10 shows the results of our analysis, displaying the percentage of managers in each of the respective HFRI index categories that have exhibited a return profile which suggests a significant relationship to the five behavioral factor categories in our framework. Our high-level conclusion is that three of the four hedge fund strategy groups had relatively similar behavioral profiles, albeit with large differences in the proportion of managers with significant factor tilts. Specifically, a meaningful number of managers across Equity Hedge, Relative Value, and Event Driven strategies had long exposure to Risk Seeking factors and/or Mean Reversion factors, with some having short exposure to Risk Aversion factors as well. For example, the green Risk Seeking bar in the top left Equity Hedge chart suggests that about 30% of managers performed well when some of the pro-cyclical factors generated positive returns. As highlighted earlier, our factor categories tend to behave similarly even across asset classes. Therefore, these results have implications for portfolio construction, and especially for allocators building a solution to offset risk from other areas of a multi-asset portfolio.
Hedge fund allocators often stress the importance of manager selection due to the high level of performance dispersion across the industry. We would expand on this idea by emphasizing the need to look beyond strategy groups, which tends to be the first step for many allocators when thinking about portfolio structure, and instead focus first on mapping the roles of individual hedge funds. We think this can help mitigate the risk of having a portfolio that appears well diversified on the surface but fails to deliver a consistent profile across different market environments.
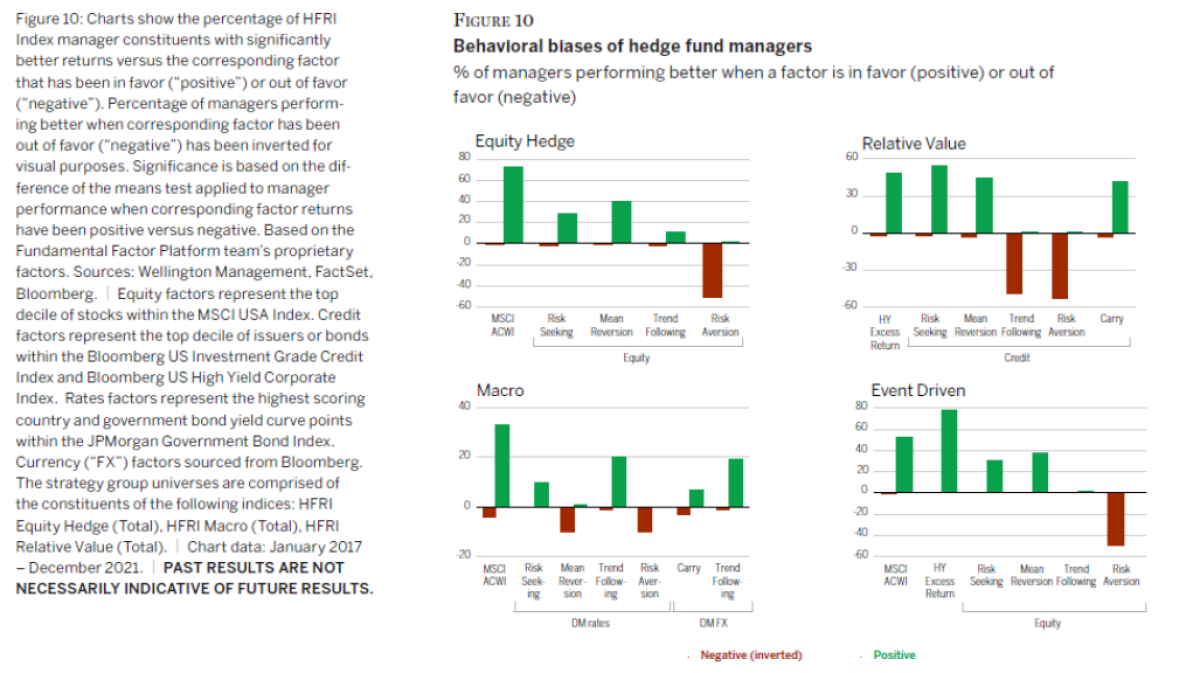
Turning to the data at the strategy group level, we would highlight several observations:
Relative Value
In the Relative Value group, more than half of managers displayed:
• Long exposure to Risk Seeking factors, more cyclical Mean Reversion factors, and Carry credit factors
• Short exposure to Risk Aversion and Trend Following credit factors
• Low sensitivity to rates factors
These tilts suggest long exposure to risk-on credit factors, short exposure to more defensive factors, and effective hedging of interest-rate exposure. We have generally observed that Trend Following credit factors tend to have defensive properties from a portfolio construction perspective; hence, negative tilts to them imply anti-defensive properties. Also, while not included in Figure 10, the sensitivities to high-yield credit factors were more pronounced than those to investment-grade credit factors, which suggests that managers have likely been leaning into the riskier parts of credit markets.
Macro
Macro funds, which are generally considered to have the most unique profiles, had relatively weak behavioral leanings in the different fundamental factor groups across asset classes. Overall, the data suggested that Macro funds, in aggregate, may be suited to the diversification role but not necessarily to the downside protection role. Less than 5% of managers had short exposure to Risk Seeking factors across asset classes, an area that tends to be associated with downside protection. Additionally, more than a quarter of Macro funds were significantly biased toward Trend Following rates factors, and specifically toward momentum in developed market government bonds and currencies. While not presented in Figure 10, this bias was observed across discretionary and systematic Macro funds (CTAs).
Equity Hedge and Event Driven
We have combined the Equity Hedge and Event Driven groups as the findings at the top strategy group level were quite similar. Not surprisingly, these two groups had the highest percentage of managers with directional tilts to equity and credit markets. One observation that was unexpected was the relatively low aggregate exposure of Equity Hedge managers to equity-based Trend Following factors. Upon further investigation, we found that many Equity Hedge managers (more than 85%) had some exposure to the Trend Following factors, but that the degree of exposure was generally fairly low. Interestingly, this effect was much less pronounced in the other factors. Generally, both Equity Hedge and Event Driven managers also had meaningful sensitivity to Mean Reversion and Risk Seeking factors (e.g., high solvency risk). The high-solvency-risk factor (equity and credit) is a factor we developed to identify companies with potential going-concern issues. We found that a high number of distressed/restructuring Event Driven funds had strong positive tilts to the factor, as we would expect.
We think these findings argue for leaning into these two strategy groups for total return enhancement. We recognize that some substrategy groups have a unique profile relative to others in their group. For example, merger arbitrage funds (Event Driven) and equity market neutral funds (Equity Hedge) may be better suited to pursuing return consistency and diversification than total return enhancement. However, since there are relatively few strategies in these subcategories, they do not meaningfully affect the aggregate picture. In summary, we find that the data illustrates the need to not be overly reliant on top-down strategy group allocations as the primary tool for achieving portfolio diversification, given the potential for common stylistic tilts.
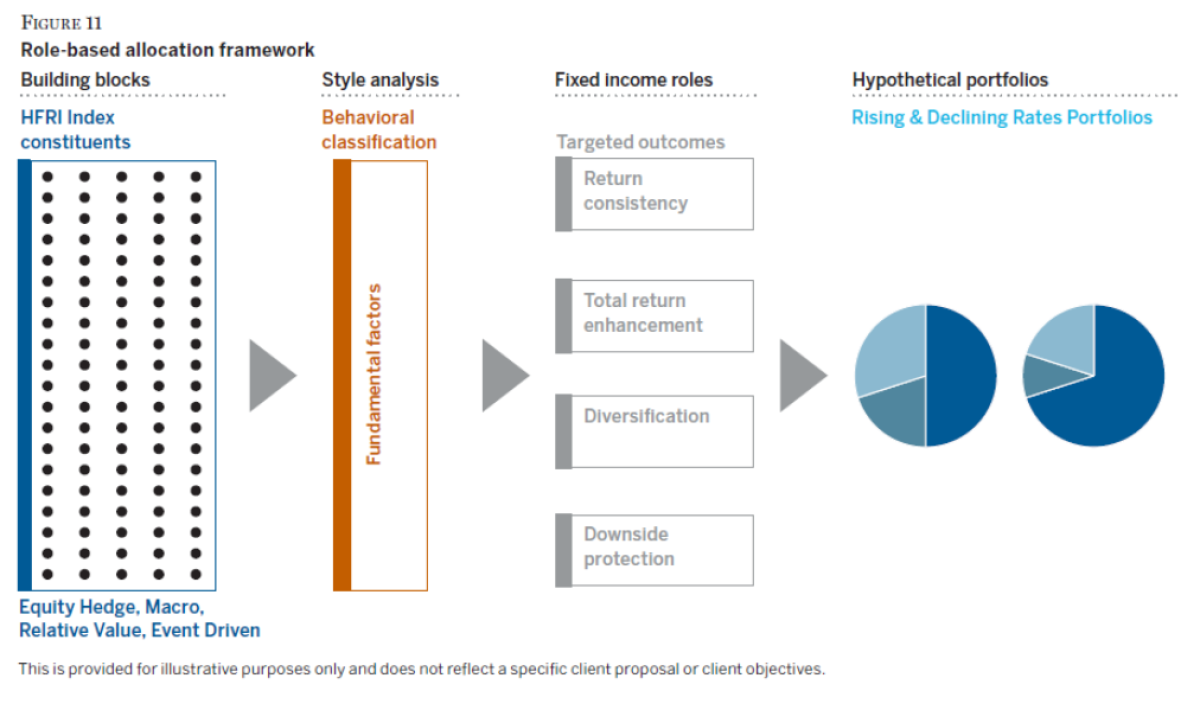
Building portfolios of hedge funds to fill specific fixed income roles
Finally, we used the findings of our factor analysis to identify hedge funds for inclusion in two hypothetical portfolios that could theoretically perform the roles of fixed income in falling and rising periods for rates. A few notes on the process we used, which is outlined in Figure 11:
• Database biases — Since this is simply an illustrative exercise, we used only five years of monthly data in order to reduce the impact of some known biases in hedge fund databases, such as survivorship bias. In practice, we would generally use longer lookbacks, higher-frequency data points, and rolling-window periods to raise our confidence in our interpretation of the results.
• Qualitative views — We believe there should be flexibility to allocate capital to managers who have had poor recent performance as long as they meet our role/behavioral-based requirements and we have conviction in their ability to generate alpha. In this research exercise, we did not have the benefit of such a qualitative understanding of the managers, but this did not impact our objective: To demonstrate the outcome of a greatly simplified version of our framework, in terms of the final portfolios’ strategy group mixes and overall characteristics.
• Fund screening — Given the limitation noted above, our fund screening process placed less emphasis on the strength of a manager’s track record and more on the role and behavioral profile of the fund. Since we do not have a view on the relative importance of the four roles of fixed income (return consistency, total return enhancement, diversification, downside protection), we designed the portfolios to have equal weights across the roles. We selected the top three fundamental factors that captured each role (to avoid single factor risk) for a total of 12 factors. To ensure more robust relationships to the desired characteristics, we identified the five funds with the strongest relationships to each fundamental factor (we arrived at five funds simply because in several cases there were relatively few funds that displayed a strong relationship to a particular factor). This process resulted in 60 funds being used in each portfolio. (Imagine the minimum investment required to build that!) In practice, we think multi-manager portfolios should generally have 8 – 12 funds, but that requires a strong qualitative understanding of the underlying managers.
• Balanced profiles — We applied some basic portfolio construction rules (e.g., equal weighting across funds with monthly rebalancing) to make the portfolios more balanced and less exposed to single-manager risk. Lastly, we did not impose any strategy group weights (e.g., Macro, Equity Hedge) and instead allowed the outcome to be driven entirely by the role-based framework.
Profiles of the hedge funds selected
Before we dive into the results of the hypothetical portfolios, we will offer some observations on the risk and return profiles of the funds that made it through the filtering process and were used to build the portfolios.
• Funds selected for downside protection and diversification included Macro and Relative Value funds and generally had a lower equity beta profile (versus the MSCI All Country World Index), with a few having negative annualized returns.
• Funds selected for total return enhancement had the highest equity beta profiles and were the only group that included Equity Hedge and Event Driven funds.
• Funds selected for the return consistency role had minimal sensitivity to equity market moves and had the highest Sharpe ratios on average.
Overview of the two hypothetical portfolios
We’ll offer a few high-level observations on the two hypothetical portfolios of hedge funds before looking at their respective profiles:
1. The two portfolios exhibited volatility profiles that were comparable to that of bonds (Barclays US Aggregate Bond Index), with historical annualized volatility of approximately 3% – 4%. They generated Sharpe ratios in the 1.0 – 1.9 range, but we would discount that and focus more on the volatility results as they have a higher chance of persisting.
2. Macro funds had the largest allocation in the two portfolios, particularly in the Rising Rates Portfolio, which may have been a result of the need to compensate for the weaker defensive properties of the portfolio.
3. Event Driven funds had almost no allocation across the two portfolios — likely because they had a similar risk and behavioral profile to Equity Hedge strategies.
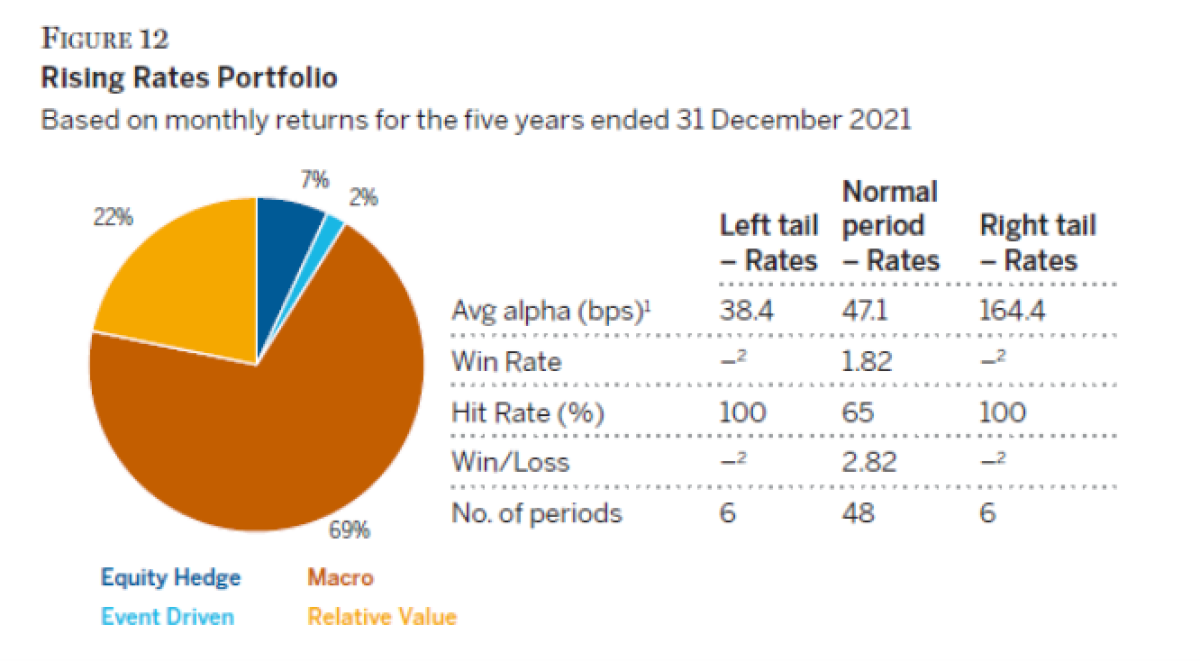
Hypothetical Rising Rates Portfolio
• As shown in Figure 12, the alpha profile was consistently positive in different rate environments but with a tilt to the rising rate periods.
• While the portfolio had a large allocation to Macro strategies, it had some exposure to the other three strategy groups as well.
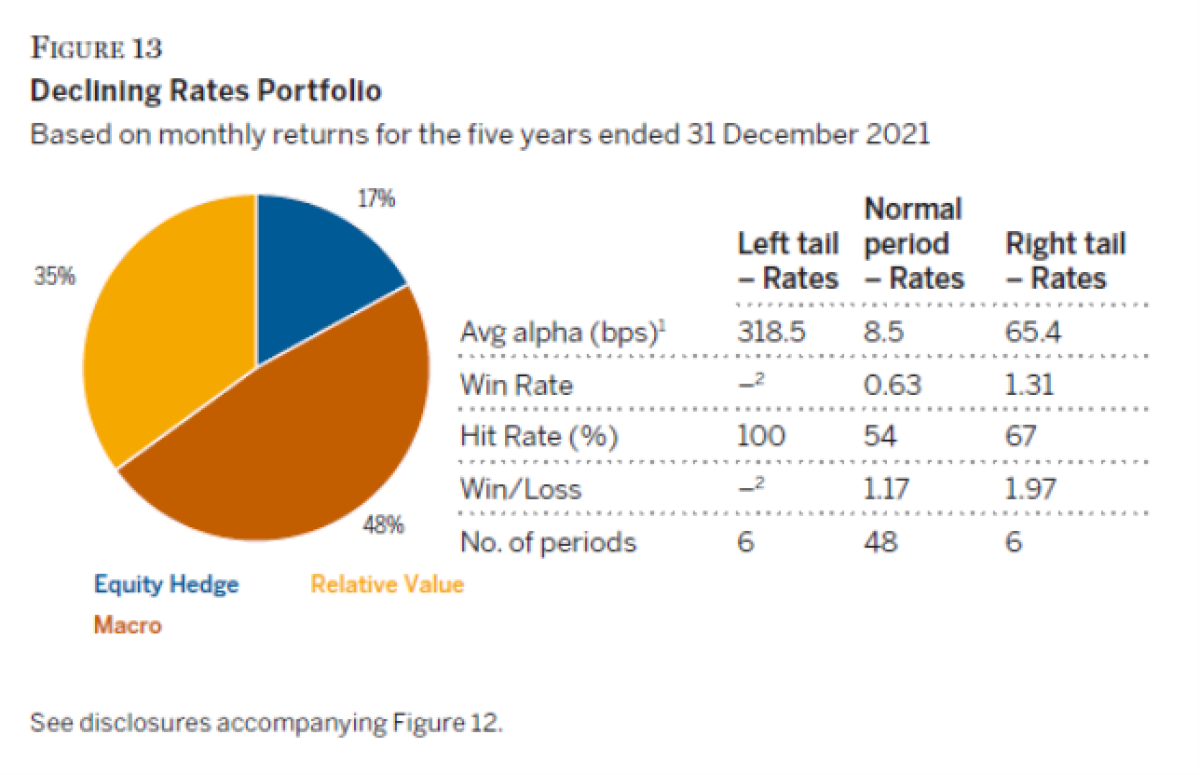
Hypothetical Declining Rates Portfolio
• Stronger performance in the left tail for rates, shown in Figure 13, was driven by a 100% Hit Rate.
• While the portfolio has a 17% allocation to Equity Hedge funds, many of them exhibited low beta to global equities.
We note that many allocators may have a need to fill specific fixed income roles (or other types of roles) as opposed to all four of the roles we have highlighted — only return consistency or diversification, for example. We believe this framework could also be used to solve for a narrower range of targeted outcomes.
Conclusion
One can point out, and rightly so, that the strong performance and risk results of the hypothetical hedge fund portfolios are not really that surprising. After all, we first identified factors that did well in the two interest-rate environments and then built portfolios of hedge funds with the strongest relationships to those factors. Our response to this observation is that in the real world, the analytics we have shared only help point to the behavioral relationships and profiles that a fund might have. As many industry practitioners know, the real challenge is determining which of those relationships and profiles are likely to persist based on a qualitative understanding of the underlying strategies. As manager researchers and allocators, we are obsessed (in a healthy way) with this iterative process of mapping and constantly updating our qualitative understanding of the role that a strategy, market, or asset class can play in a portfolio.
Our goal was to demonstrate the benefits of using a role- and behavior-based approach to increase alignment between manager research, the investment process, and portfolio objectives. Ultimately, the process led to hypothetical portfolios that have volatility below the broader hedge fund universe and more comparable to fixed income. We also wanted to illustrate the similarity of the behavioral profiles of the common hedge strategy groups. While we recognize the importance of incorporating the strategy group allocations into the decision-making process, we think that in many cases it should be a secondary consideration.
About the Authors:

The authors are members of Wellington’s Fundamental Factor Team, which manages multi-strategy portfolios across traditional and alternatives offerings, conducts market, factor and manager research, and partners with clients on investment solutions, including strategies for pursuing customized risk and alpha objectives.


IMPORTANT DISCLOSURES
The hypothetical portfolios are shown for illustrative purposes only. Hypothetical performance is developed with the benefit of hindsight (i.e., actual knowledge of market conditions, result of similar strategies) and thus has many inherent limitations. Actual performance may differ substantially from the hypothetical performance presented. The returns do not include value added from active asset allocation. In response to changes in the capital market environment, a manager may change the normal policy weights and add new portfolios to the aggregate portfolio.
This does not reflect allocation decisions made under actual market conditions and therefore cannot completely account for the impact of risk in actual trading. As such, none of the hypothetical performance should be considered an indication of the future performance of an approach managed in this blended style. There are often differences between the hypothetical performance results and actual results of a live portfolio.
The hypothetical portfolios are based on a number of assumptions that are explained in this paper. Certain of the assumptions have been made for modeling purposes and may not be repeated. Changes in the assumptions may have a material impact on the simulated returns presented. The allocation percentages of the portfolios were rebalanced monthly to maintain the original allocation percentages. This rebalancing does not consider the liquidity provisions of the underlying funds, which may not allow for such frequent redemptions.
Each hypothetical portfolio includes 60 underlying funds. In practice, this would be difficult to build and an actual multimanager portfolio would likely have fewer underlying funds. Underlying funds were equal weighted and did not impose any strategy group weights (e.g., Macro, Equity Hedge) and instead allowed the outcome to be driven entirely by the role-based framework described in this paper.
Gross performance results are net of commissions and other direct expenses, but before (gross of) advisory fees, custody charges, withholding taxes, and other indirect expenses, and include reinvestment of dividends. If all expenses were reflected, the performance shown would be lower. Actual fees will vary depending on, among other things, the applicable fee schedule and account size.
This material and/or its contents are current at the time of writing and may not be reproduced or distributed in whole or in part, for any purpose, without the express written consent of Wellington Management. This material is not intended to constitute investment advice or an offer to sell, or the solicitation of an offer to purchase shares or other securities. Investors should always obtain and read an up-to-date investment services description or prospectus before deciding whether to appoint an investment manager or to invest in a fund. Any views expressed herein are those of the author(s), are based on available information, and are subject to change without notice. Individual portfolio management teams may hold different views and may make different investment decisions for different clients.