


By Nicolas Rabener of FactorResearch (@FactorResearch)
INTRODUCTION
One of the most perplexing questions in the investment industry is why liquid alternatives have not been able to disrupt the hedge fund industry in the same way that ETFs have captured significant market share from mutual funds.
Neither hedge funds nor mutual funds have created much value as measured by their alpha generation in recent years, which is primarily explained by high fees eating away any excess returns generated by the fund managers. Liquid alternatives tend to feature lower management and zero performance fees, which should be a more attractive value proposition for investors seeking alternatives.
In addition, hedge funds represent unregulated vehicles that require plenty of costly initial due diligence and ongoing monitoring, compared to liquid alternative mutual funds that are traded on regulated US exchanges.
Despite all these good arguments, the total assets under management in liquid alternative mutual funds were approximately $400 billion in the US in 2020, which is just barely more than 10% of the assets of the $3.6 trillion hedge fund industry. Why has the disruption failed?
In order to evaluate the lack of interest in liquid alternative mutual funds, we will analyze the 10 largest ones in the US.
FEES
We select the 10 largest liquid alternative mutual funds in the US that focus on equities, which includes long-short, market neutral, event-driven, merger arbitrage, and similar strategies. These 10 funds manage a cumulative $40 billion of assets, so approximately 10% of the entire assets under management of the liquid alternative space.
Although liquid alternative mutual funds aim to disrupt the hedge fund industry by offering lower fees, they are not particularly cheap. The average fee across these 10 funds is 1.6%, which equates to an annual fee income of $550 million for the asset managers. In comparison, State Street earns only $320 million in fees for managing the SPDR S&P 500 Trust ETF (SPY), which is the largest ETF globally with $356 billion of assets under management. Liquid alternatives are one of the few areas within the asset management industry where fees have remained relatively high.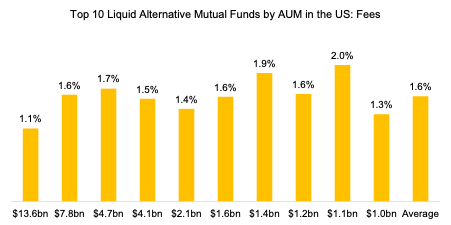
Source: FactorResearch
FACTOR EXPOSURE ANALYSIS
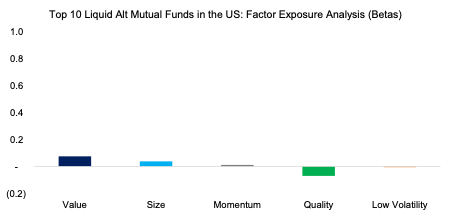
Although we know that these 10 funds trade equities, we do not understand what is driving their returns. In order to gain some insight, we run a factor exposure analysis against five common equity factors. We might have expected positive exposure to a value or size factor, but on average the exposure to each of the factors is zero.
This result can be interpreted as positive or negative. It can be regarded as positive as investors can get factor exposure more cheaply, e.g. via smart beta ETFs, and do not need liquid alternatives mutual funds for this. Instead, the funds can focus exclusively on generating true alpha, i.e. returns that cannot be attributed to the stock market or factors.
However, this result may also caution investors as generating alpha is hard. Factor investing is well-supported by research and having factor exposure might have given these funds a higher probability to generate excess returns, even if it were to only represent alternative beta rather than alpha.
Source: FactorResearch
CORRELATION TO EQUITIES
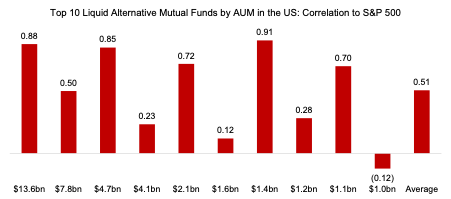
Given that these 10 funds did not offer exposure to factors, we take a step back and investigate if they provided exposure to plain market beta. Unfortunately, half of the funds had a correlation of more than 0.7 to the S&P 500, which makes these less attractive to investors as they provide few diversification benefits. Stated differently, they are not alternative enough and represent expensive equity proxies.
Only four funds have a correlation below 0.3, which implies returns uncorrelated to the stock market. If these offer positive returns as well, then this would make them highly valuable for portfolio diversification.
Source: FactorResearch
PERFORMANCE OF LIQUID ALTERNATIVE MUTUAL FUNDS
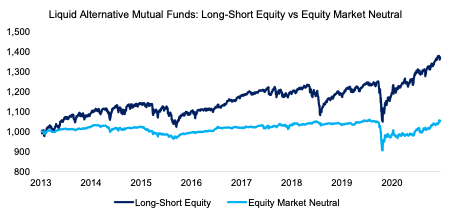
Next, we create a Long-Short Equity Index comprised of the six liquid alternative mutual funds that exhibited a correlation of larger than 0.3 to the S&P 500. The other four funds are used to create an Equity Market Neutral Index.
As expected, the Long-Short Equity Index exhibited higher volatility and more cyclicality than the Equity Market Neutral Index.
There is no better way to measure the alpha of a fund manager than when his portfolio is structured equity market neutral. Unfortunately for the liquid alternative managers pursuing this strategy, the performance highlights zero alpha generation since 2013. Equity markets are highly efficient, and it seems that there are no free lunches left.
Furthermore, it is worth highlighting that equity market neutral funds experienced a 15% drawdown during the COVID-19 crisis in March 2020, which is precisely the period when investors required portfolio protection from such products. The drawdown is explained by merger arbitrage strategies that bet on mergers to complete, which did not happen when the global pandemic unfolded.
Source: FactorResearch
REPLICATING LIQUID ALTERNATIVE MUTUAL FUNDS
Liquid alternatives mutual funds pursuing equity market neutral strategies have been outright unattractive in the period from 2013 to 2021 as they offered neither positive returns nor diversification benefits when needed. Theoretically, they are the most attractive products for portfolio diversification, but they disappoint in reality.
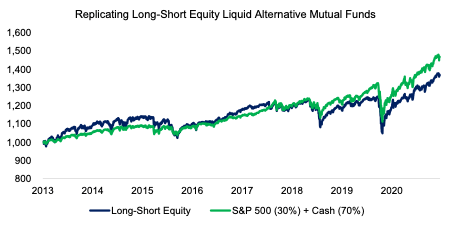
Funds following long-short equity strategies typically market themselves as offering a similar upside as the stock market, but reduced downside. It is an appealing story for investors, although difficult to achieve as it essentially assumes market timing. There is little evidence that any asset manager has mastered this.
Long-short equity funds therefore typically represent watered-down versions of market beta, with reduced upside and downside. We can demonstrate this by comparing the Long-Short Equity Index to a simple combination of the S&P 500 (30%) and zero-interest cash (70%), which generated almost identical performance between 2013 and 2021.
Source: FactorResearch
FURTHER THOUGHTS
Although the 10 liquid alternative mutual funds manage $40 billion, they have offered little compelling value to investors. Our previous research shows a similar conclusion for most hedge fund strategies, especially equity market neutral and merger arbitrage.
Given this, it is not perplexing why there is little interest in liquid alternative mutual funds, but still difficult to explain why more than $3 trillion are allocated to the hedge fund industry.
The irony is that investors are desperate for alternatives to fixed income as expected bond returns are low to negative. The outlook for hedge funds could be bright, had their past not been so dark.
RELATED RESEARCH
Managed Futures: Fast & Furious vs Slow & Steady
60/40 Portfolios without Bonds
Volatility Hedge Funds: The Good, the Bad, and the Ugly
Global Macro: Masters of the Universe