

By Alan Dunne, CEO | Founder of Archive Capital.
Summary
-
The classic trade-off between economic growth and inflation is re-emerging for the Fed
-
Although forward looking indicators point to slowing growth, there is an unusual amount of uncertainty in this cycle around the sensitivity of growth and inflation to higher rates
-
The recessions of the 1960s, 1970s and 1980s may offer better clues as to how sensitive inflation will be to slowing growth than the economic downturns in the last two decades
-
The current political support for higher rates will likely diminish as the economy slows in response to the higher rates
-
As the cost of reducing inflation becomes apparent, expect to hear more calls for the Fed to tolerate a higher rate of inflation
Investment Implications
-
The Fed’s current motto of being “humble and nimble” means a likelihood of greater volatility in interest rate and fixed income markets
-
Greater macro and interest rate volatility should offer opportunities for tactical and directional trading strategies
-
Markets appear to be underpricing the risk that there may be a structural drift higher in the Fed’s inflation target; financial repression is likely to continue to be a theme
Financial markets continue to struggle to adjust to the dynamics and implications of a new type of tightening cycle.
In January, in Is this the end of gradualism? we wrote that having delayed withdrawing stimulus the Fed would have to abandon the gradualist approach to monetary policy that characterized each tightening cycle this century.
After raising rates 25bps, 50bps and 75bps at consecutive meetings since March, the fastest pace of tightening since the 1980s, there is little doubt that we are into a new era of central bank policy making.
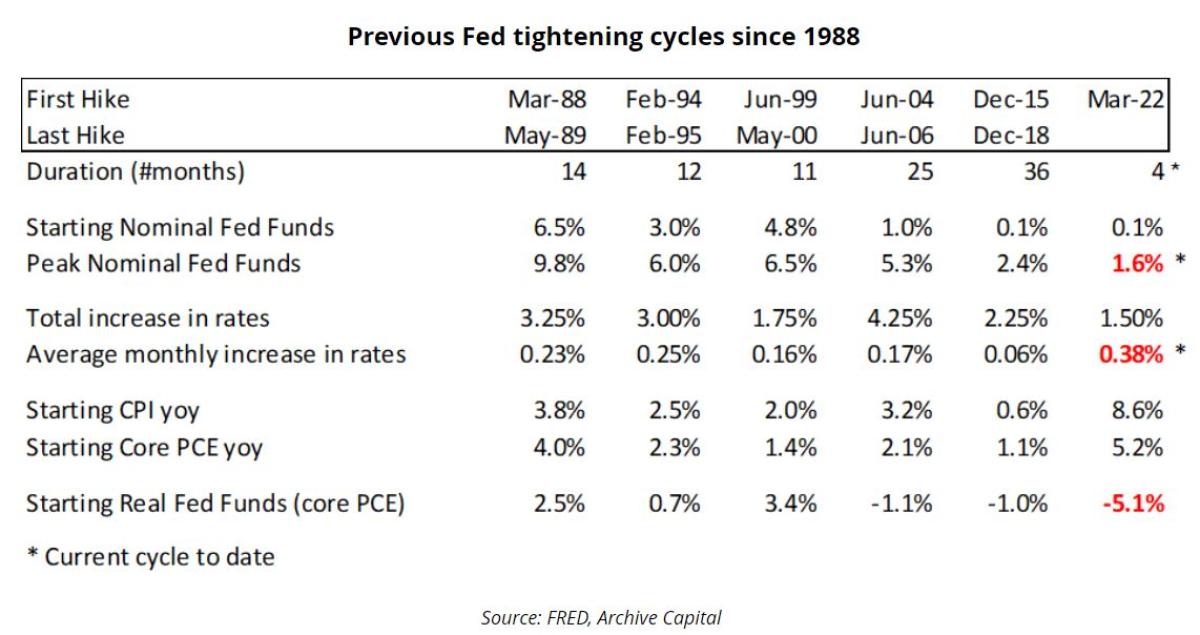
The key differentiator in this tightening cycle is that the Fed is using monetary policy to slow the economy to bring inflation down. At the start of every other tightening cycle since 1994, core PCE was 3% or less at the start of the cycle and policy was aimed at ensuring the economy didn’t overheat rather than actively attempting to reduce inflation.
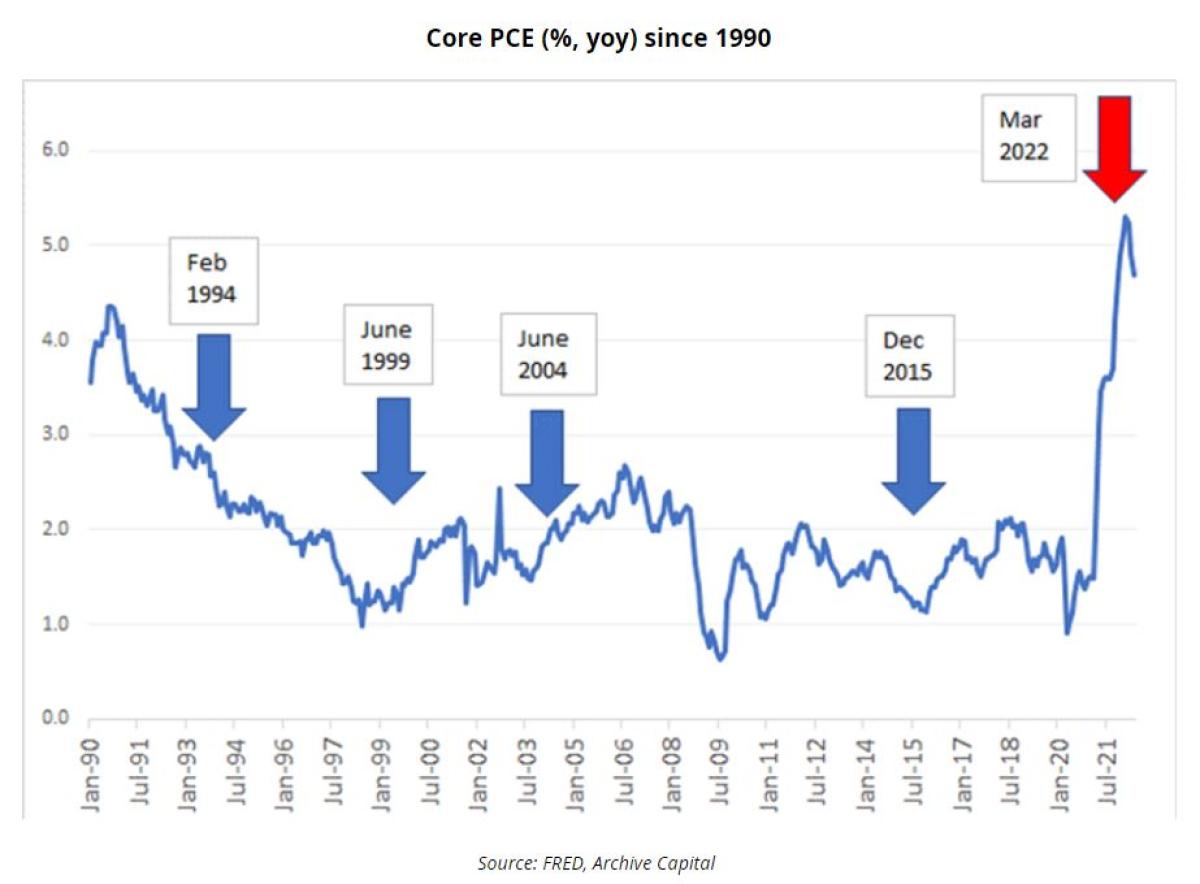
What this means is the starting point is one of deeply negative real interest rates and the last two decades may offer little precedent for this cycle.
Here we assess three key questions that will be critical in this cycle:
1. How sensitive will growth be to monetary tightening?
2. How sensitive will inflation be to weaker economic growth?
3. What is the ultimate target for inflation?
How sensitive will growth be to higher rates?
At any point in time in financial markets there is a spread of bulls and bears, doves and hawks and optimists and pessimists. That spread of opinion feels unusually large at the moment.
Take crude oil as an example: JPMorgan sees potential for crude oil to rise to $380, while Citi are forecasting a decline to $65 by year end.
That uncertainty is also evident in relation to the broader economic outlook. Growth pessimists see growth rather than inflation as the primary challenge with some forecasting rate cuts by the Fed by year end. Others see inflation becoming more entrenched with the risk that rates may need to rise as high as 8% to bring inflation back in line.
The consensus is that the economy will slow but by how much, in what time frame and for how long.
As Chair Powell pointed out at his recent congressional testimony, ultimately the Fed wants to bring growth down to below trend but not below zero. But the question from a market perspective is how high will interest rates need to go and will the Fed be successful in achieving the soft landing.
In the aftermath of the 8.6% print for May CPI, interest rate futures moved to price in a much more aggressive policy path from the Fed. Dec 2022 Eurodollar futures declined by over 100bps between 26 May and 14 June with about 60bps coming in the two days on and after the CPI release. The Fed validated the expectation of a more aggressive tightening cycle in June with a 75bps hike, the first of this magnitude since 1994.
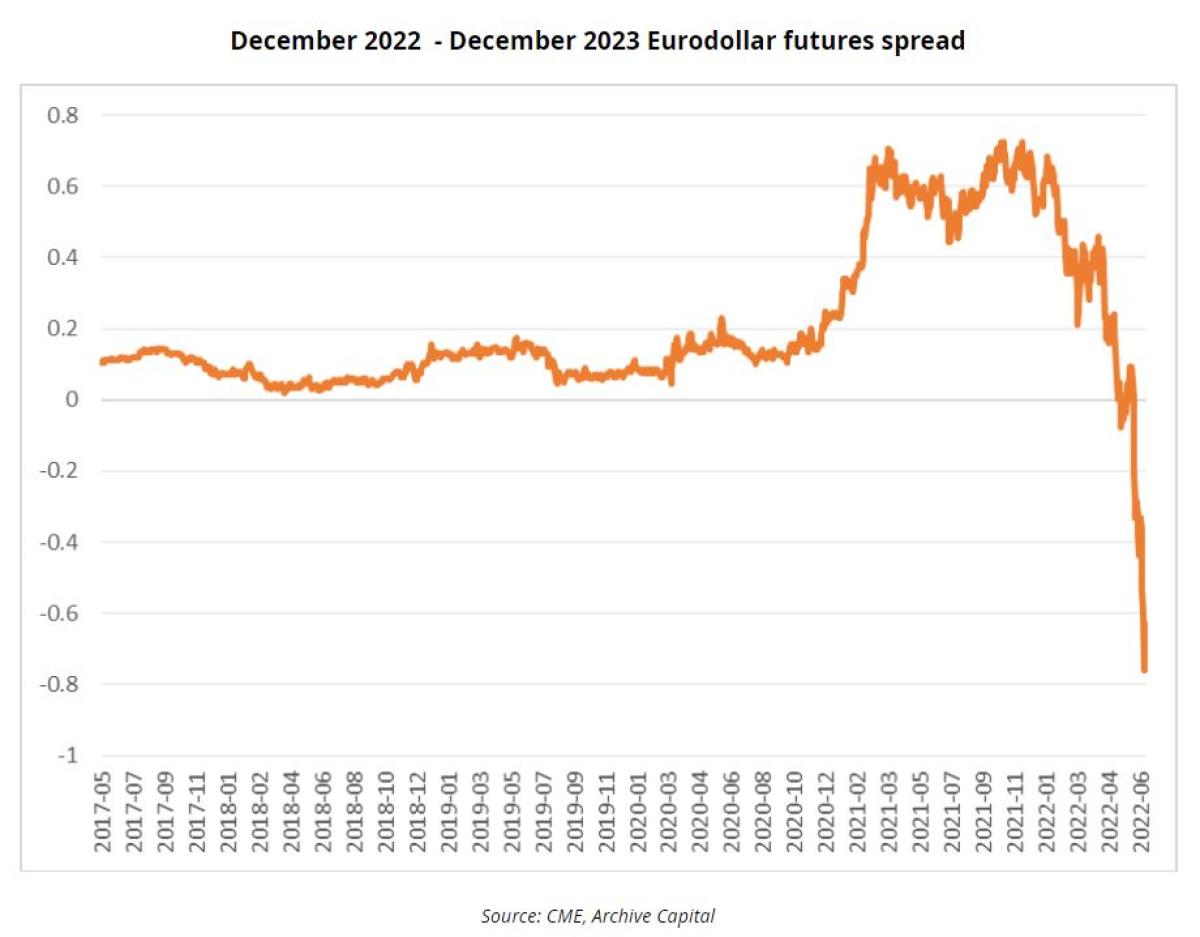
However, since the June FOMC meeting, investor focus has shifted to concerns about growth rather than inflation. US 10-year yields are currently about 60bps off their highs and Dec 2023-Dec2022 Eurodollar future spread point to about 75bps of easing in US short rates in 2023 (a shift from +10bps of tightening in 2023 in early June).
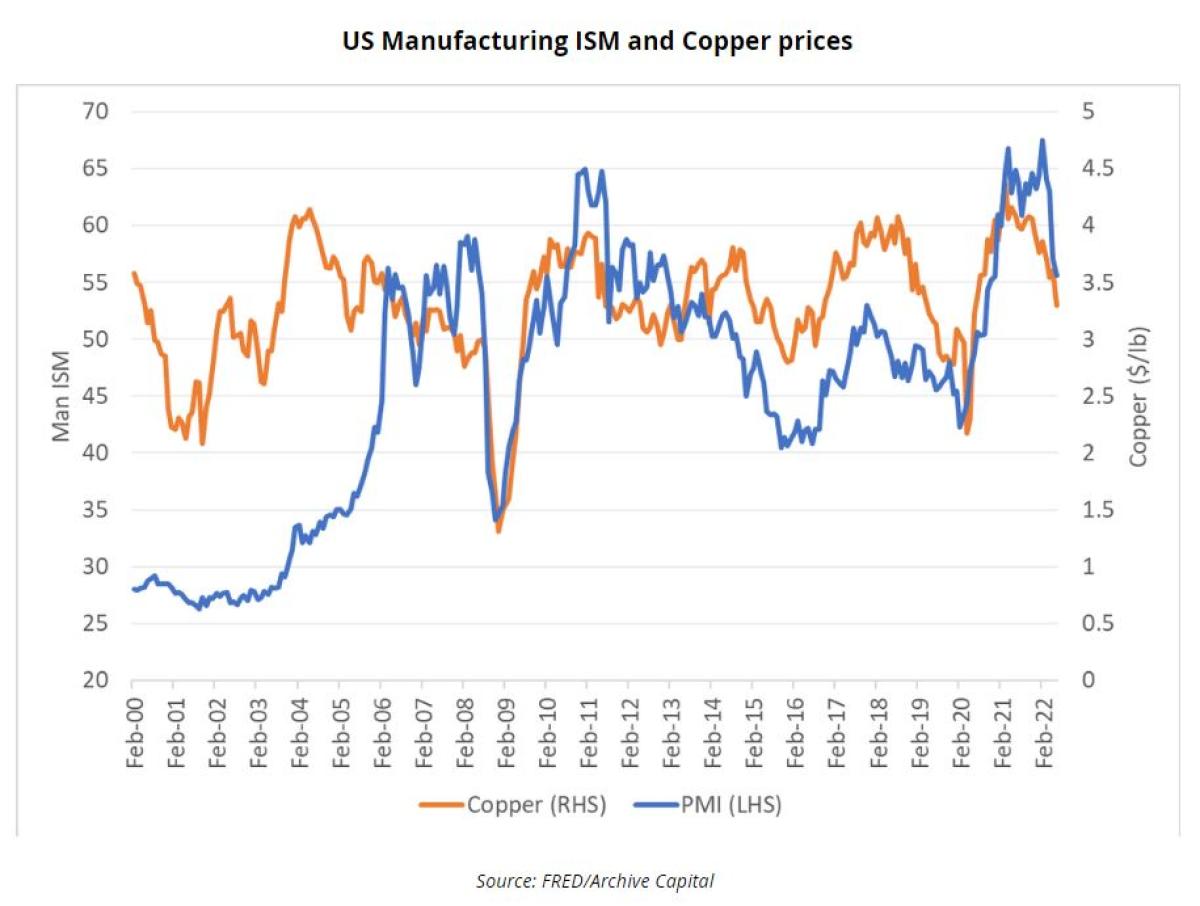
The more aggressive approach by the Fed, weakness in equities, the sharp falloff in consumer confidence, the decline in growth sensitive commodities such as copper, signs of a slowdown in the recent manufacturing ISM new orders index and the sharp increase in mortgage rates are all forward looking indicators pointing to a slowdown.
Currently, Eurodollar futures markets are pricing a rise in rates to just over 3.5% by year-end but for the Fed to be cutting rates in 2023.
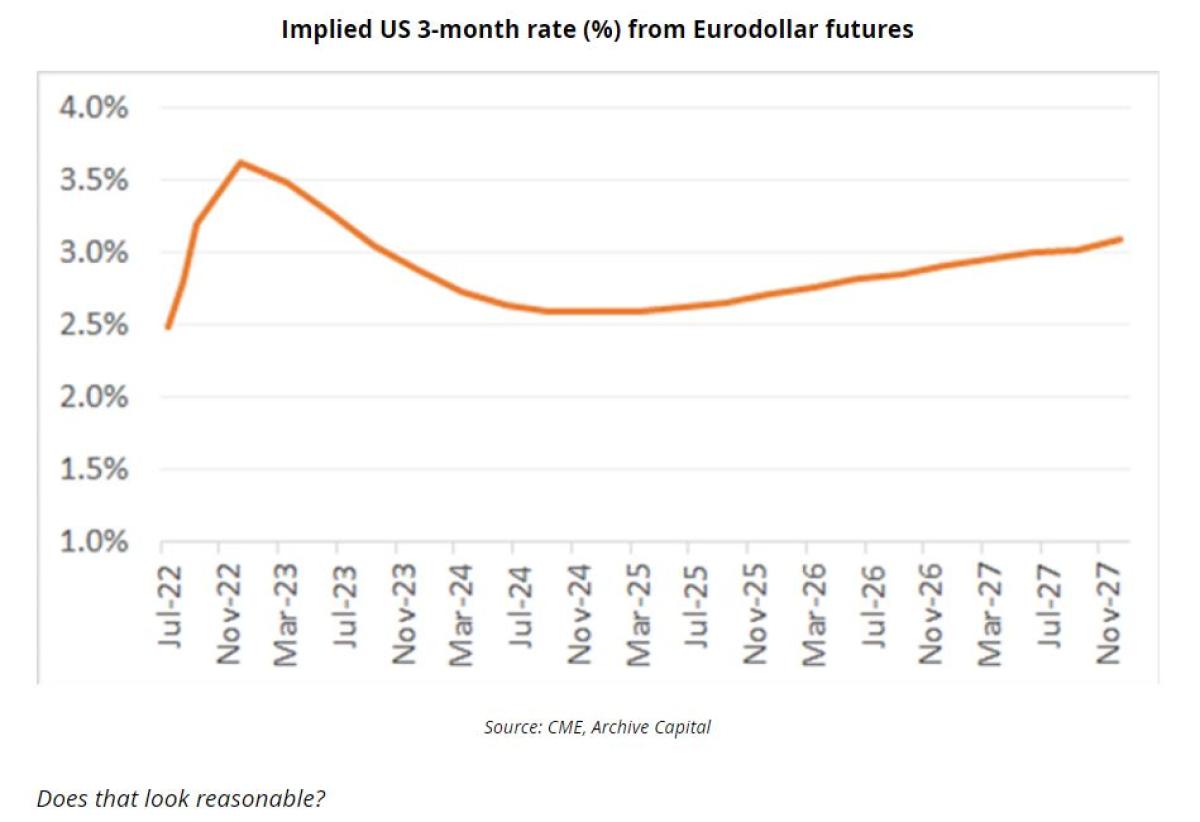
A rise in rates to 3.5% would mark a more aggressive hiking cycle than between 2015-2018 but a smaller net increase in rates than in 2004-2006 even though inflation is substantially higher now than in that period.
In 2019 the Fed lowered rates seven months after its last rate increase the 2015-2018 cycle: that may explain the expectation of a quick unwind of some of the tightening in 2023.
Three factors make it particularly difficult to assess how much growth might slow in response to higher rates:
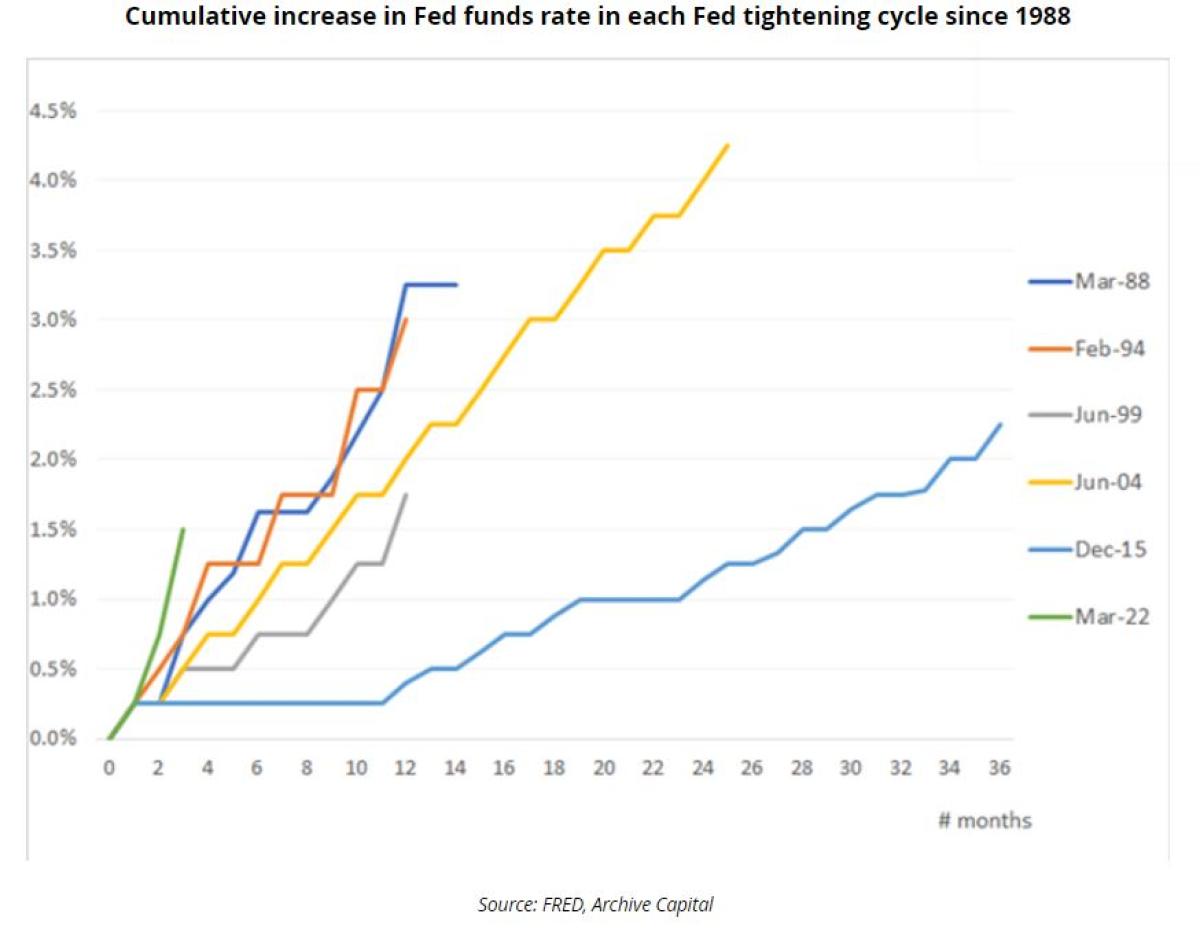
1. Rate increases have been unusually quick but from exceptionally low levels. It’s the first time since 1994 the Fed has raised rates by 75bps. Indeed, having initially being slow to withdraw stimulus, the current pace of rate increases is faster and more aggressive than any rate hiking cycle since the 1980s.
2. Higher interest rates (and the start of quantitative tightening) have translated into higher 10-year yields and a broader tightening of financial conditions. In the 2004-2006 tightening cycle, the Fed funds rate rose by 4.5%. However, in that cycle bond yields initially did not rise with interest rates (Greenspan’s bond market conundrum) and consequently financial conditions didn’t tighten until the latter stages of the tightening cycle. This time around US-10 year yields have risen close to 3% from the lows in March 2020 the largest increase since the late 1980s.
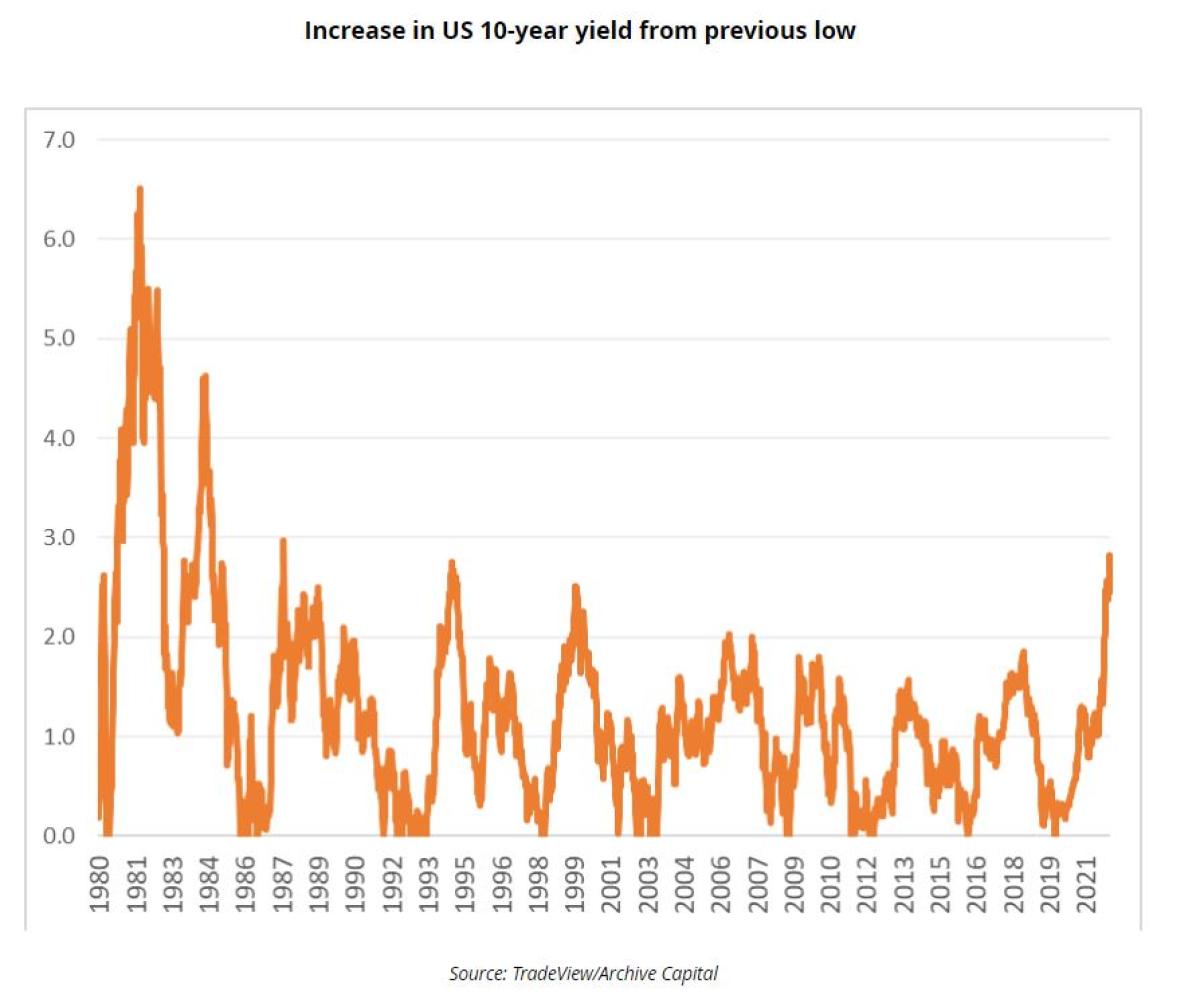
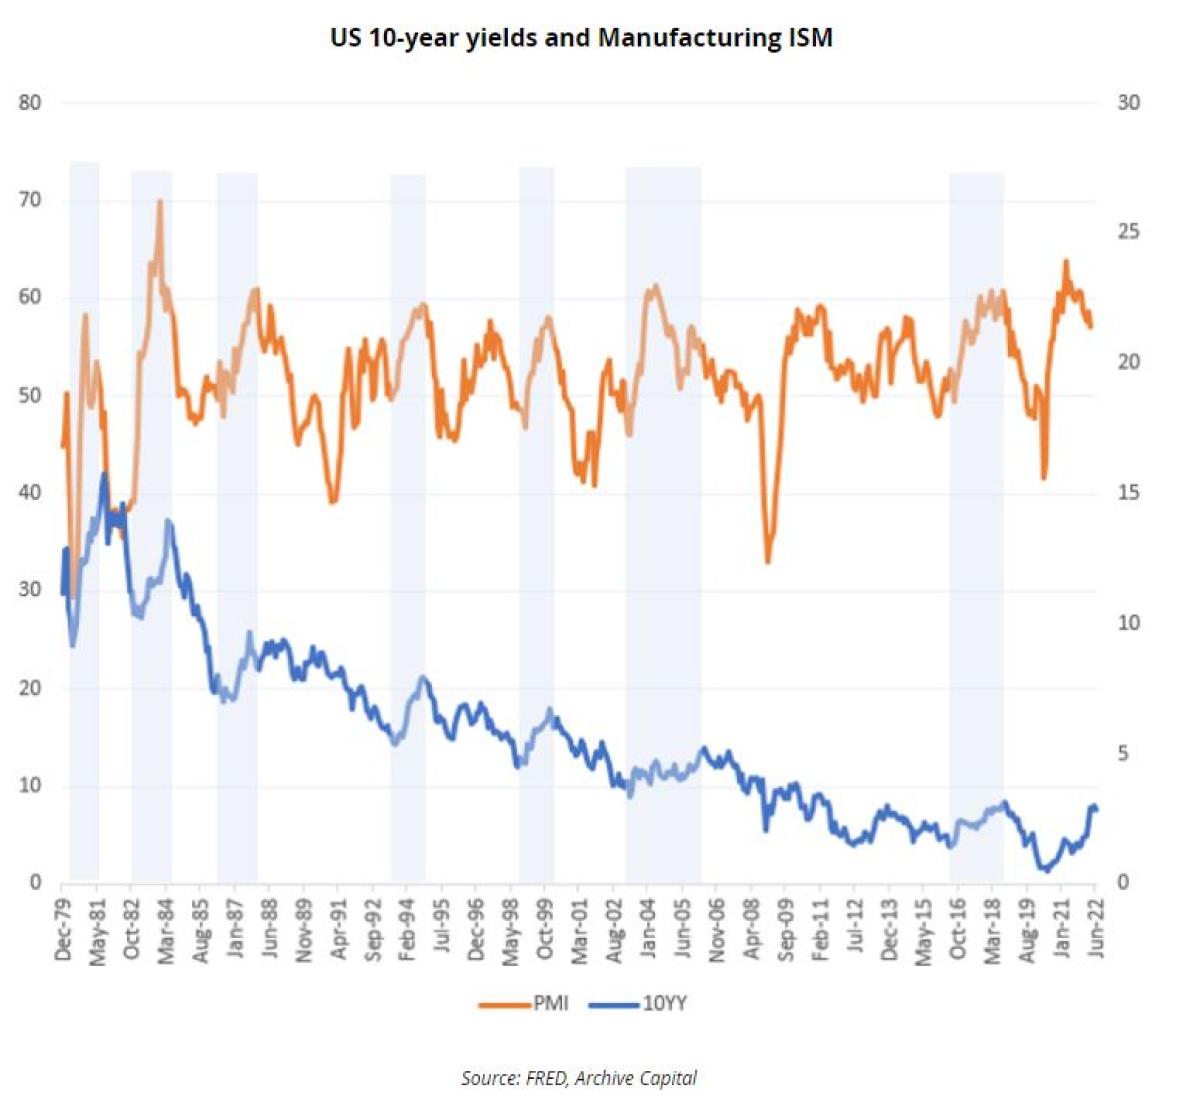
Weakness in equities, bonds and credit have tightened financial conditions and reduced wealth. At the same time consumers’ real incomes have been eroded by higher energy prices. Historically such rapid increases in yields have been associated with notable declines in the PMI so a slowdown does look likely. That said, yields rose a similar amount in 1994 and the Fed did achieve a soft landing in that case.
3. However, what is unusual about this cycle is real interest rates (as measured by current inflation) are still negative. Even taking core PCE rather than headline CPI as the relevant measure of inflation and interest rates are still negative in real terms. In standard economic textbooks it is real interest rates that typically drive behavior.
Historically, negative real rates have tended to occur at the end of recessions rather than precipitating recession (such as 1971,1975 and 1980). Negative real interest rates could motivate consumers to borrow to bring forward consumption even with rising interest rates. It is noteworthy that consumer credit growth has been rising recently (although possibly due to the squeeze on real incomes).
In summary, although many indicators now point to a slowdown, the economy is particularly strong at the moment and there is an underlying support from real interest rates, so the timing and magnitude of the downturn remains open for debate.
How quickly and how much growth might slow in response to higher rates is only the first part of the current investment puzzle. Understanding how much inflation may slow in response to weaker growth will be key for understanding the Fed’s reaction function.
In the Global Financial Crisis and during the initial phase of COIVID CPI fell sharply as unemployment rose and the economy weakened. However, in this cycle because (1) wages may respond with a lag to recent inflation and (2) supply side challenges may remain there is a risk that inflation remains sticky even as growth weakness.
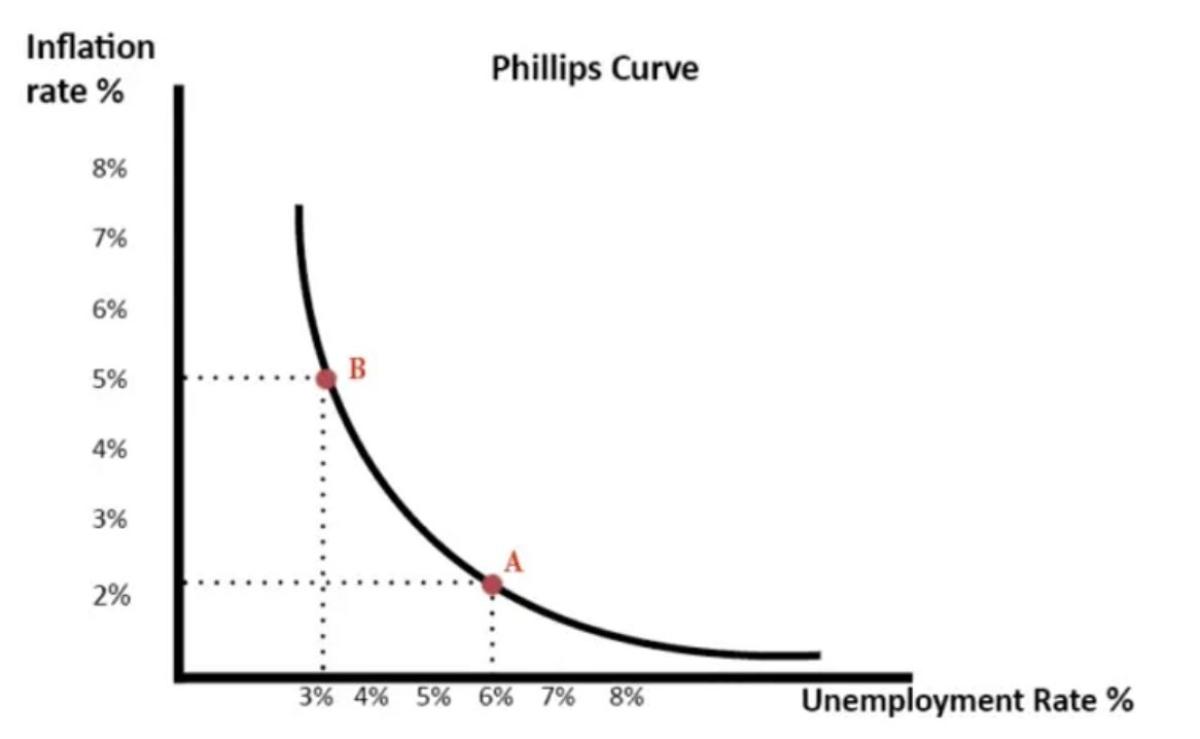
The inflation-unemployment trade-off
The relationship between inflation and unemployment, as captured by the Philips Curve, has long been a controversial and hotly debated topic in economics.
In the 1960s, Philips’ observation that there appeared to be a relationship between wage growth and unemployment, and then more generally between overall inflation and unemployment, encouraged a belief amongst policy makers that the relationship could be exploited i.e., by accepting a higher level of inflation unemployment could be maintained at a permanently lower level. In effect the question was how much inflation should be tolerated to bring unemployment down.
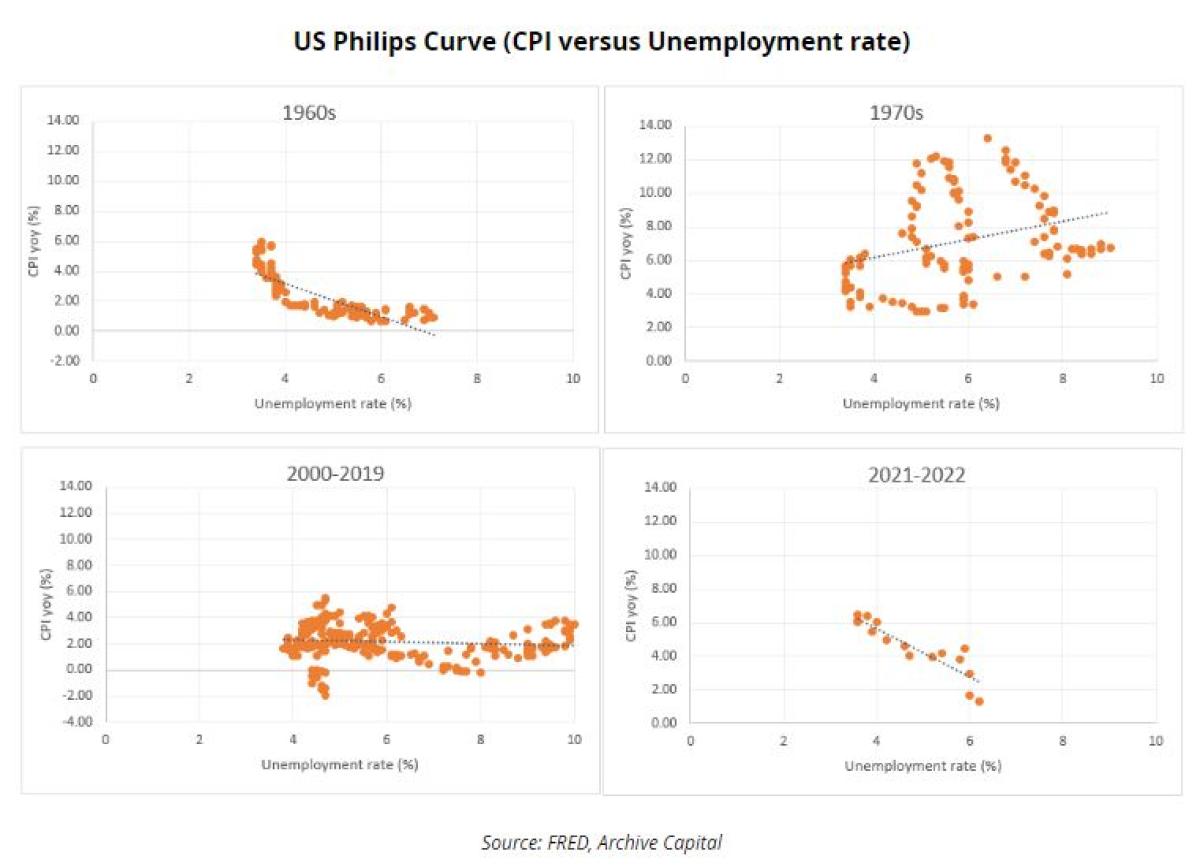
However, the 1970s proved that the relationship was not stable. Because workers might adjust to repeated monetary easing with higher inflation expectations and wage demands the result would be accelerating inflation without lower unemployment. This spawned the concept of the NAIRU (the non-accelerating inflation rate of unemployment). The stagflation of the 1970s appeared to support this interpretation.
However, over time as central bankers shifted their focus to price stability and influencing inflation expectations, there was evidence that the Phillips curve was still in existence but due to various factors the curve had flattened. Whereas Hooper et al (2019) estimated that the Phillips curve had a -0.7 slope for the 20 years to the early 1990s, by 2019 the estimate was about -0.2.
This interpretation was part of the rationale for the Fed running the economy hot in 2019 and post COVID, as there was a general belief that a tight labor market would not prompt higher inflation.
However, post-COVID we have again seen a shift in the relationship between unemployment and inflation. Supply side constraints coupled with strong demand fueled by easy money and stimulative fiscal policy has pushed up inflation substantially as unemployment has fallen.
One explanation for why inflation may have taken off is that at very low levels of unemployment the curve may be non linear and inflation will rise quickly in a tight labour market. Based solely on the unemployment rate, the labor market doesn’t look unusually strong versus 2019 but other labor market indicators like quits and job openings have suggested that it is unusually tight.
Why does all this matter to the current debate?
Economists and policymakers have long focused on the Phillips curve to answer the question how low can unemployment go without causing significant inflation, but in the current market the relevant question becomes how much must unemployment rise to get inflation back to target?
If inflation proves to be sticky then the cost of reducing inflation (in terms of lost output and rising unemployment may be substantial).
Indeed, looking at past periods when the Fed was actively trying to reduce inflation, we can see that inflation proved to be quite stubborn in the face of rising unemployment.
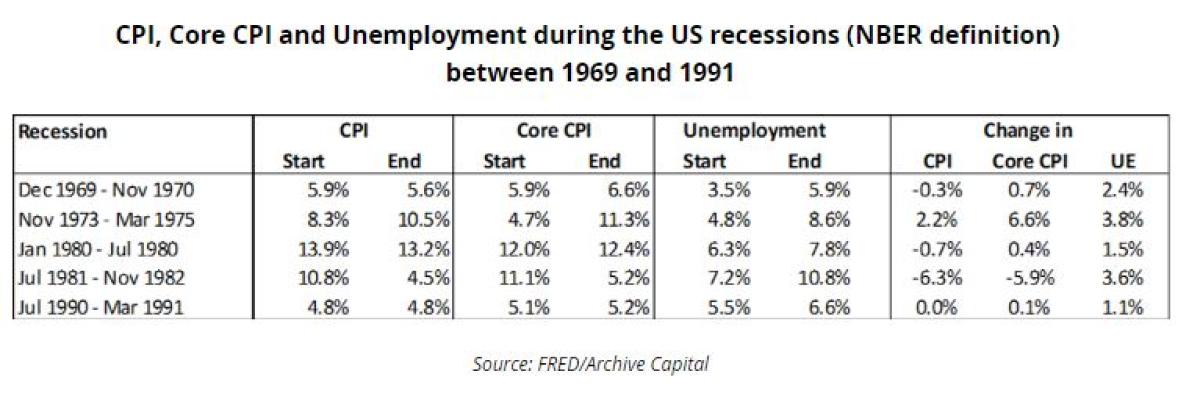
For example, in the 1970 recession, unemployment rose by 2.4% and edged slightly higher just after the recession. But CPI fell just -0.3% in the period and core CPI actually rose. A 2.5% increase in unemployment in the current US labour market would be a loss of about 4m jobs. The cost of the 1973-1974 recession was even greater, largely due to the oil crisis.
With inflation running at rates in excess of 8% and the economy booming there was widespread political support for higher rates. However, as the economy slows in response to higher rates the Fed will face the trade-off between unemployment and inflation.
The standard argument for why reducing inflation is more favorable than keeping unemployment low is that higher inflation impacts everybody in the economy whereas lower unemployment only benefits those people who are employed and would otherwise be unemployed if the economy slowed.
However, that’s a somewhat superficial analysis. There are a number of winners and losers to higher inflation. Higher inflation favors debtors overs creditors. Higher inflation favors homeowners over those searching for a home. Higher unemployment tends to disproportionately impact the lower classes. Reducing unemployment for marginalized groups had been a key objective for the Powell Fed in the pre-covid economy (remember at one point even a suggestion of targeting the rate of black unemployment).
Bear in mind that after his tenure at the Fed former Chair Arthur Burns attributed the inflation of the 1970s to a lack of political support for quelling inflation during that period; the cost of reducing inflation in terms of lost employment was deemed politically unpalatable until Volcker.
To the extent that reducing inflation involves a prolonged increase in unemployment coupled with lower equities (already the case) and possibly lower house prices it is easy to see how the political support for higher rates may diminish over time.
That’s why the Philips curve has become important again. A 2% rise in the unemployment rates to reduce inflation by 2-3% may be an attractive trade-off but a 3-4% rise in unemployment to achieve the same goal may prompt calls for a reassessment of the policy mix.
What is really the inflation target? 2% or 4%?
That brings us to the third significant uncertainty at the moment: does the Fed really want to get inflation back to 2%?
Publicly, the Fed continues to state that its target is to bring inflation back to 2%. However, we have already seen calls from economists for considering a relaxation of the 2% target.
In a recent column, “How low must inflation go”, Paul Krugman outlined how 2% became the standard inflation rate for price stability (largely because that was what the early inflation targetters such as the Reserve Bank of New Zealand chose rather than any economic rationale) and outlined a case for a higher inflation target.
The suggestion that central banks should consider targeting a higher level of inflation came to the fore after the Global Financial Crisis as central banks struggled to push real interest into negative territory without dealing with the negative consequences of negative nominal rates.
In 2010, IMF Chief Economist Oliver Blanchard outlined a case for a 4% inflation target. At the time it was an academic debate as regardless of what you thought was the correct inflation target, the big problem facing central banks was the inability to generate sufficient demand to push up inflation.
That’s no longer the case. One side effect of the current inflationary surge is that it offers the option to reset the definition of price stability or the inflation target to give the flexibility of having more negative interest rates when the economy next needs monetary stimulus.
As Krugman points out, from an economic perspective there is no real reason why the Fed or any other central bank should want to get back to 2%. 3%, 4% or 5% could all be just fine. The main argument for 2% is to maintain credibility.
How quickly central banks can reduce inflation is partially out of their hands (commodity prices and the supply side impacts of COVID will have a significant impact). If the perception increases that the cost of each incremental reduction in inflation is too large (in terms of lost output and unemployment) its easy to engage a scenario where the Fed may be willing to accept inflation in a 3-4% range.
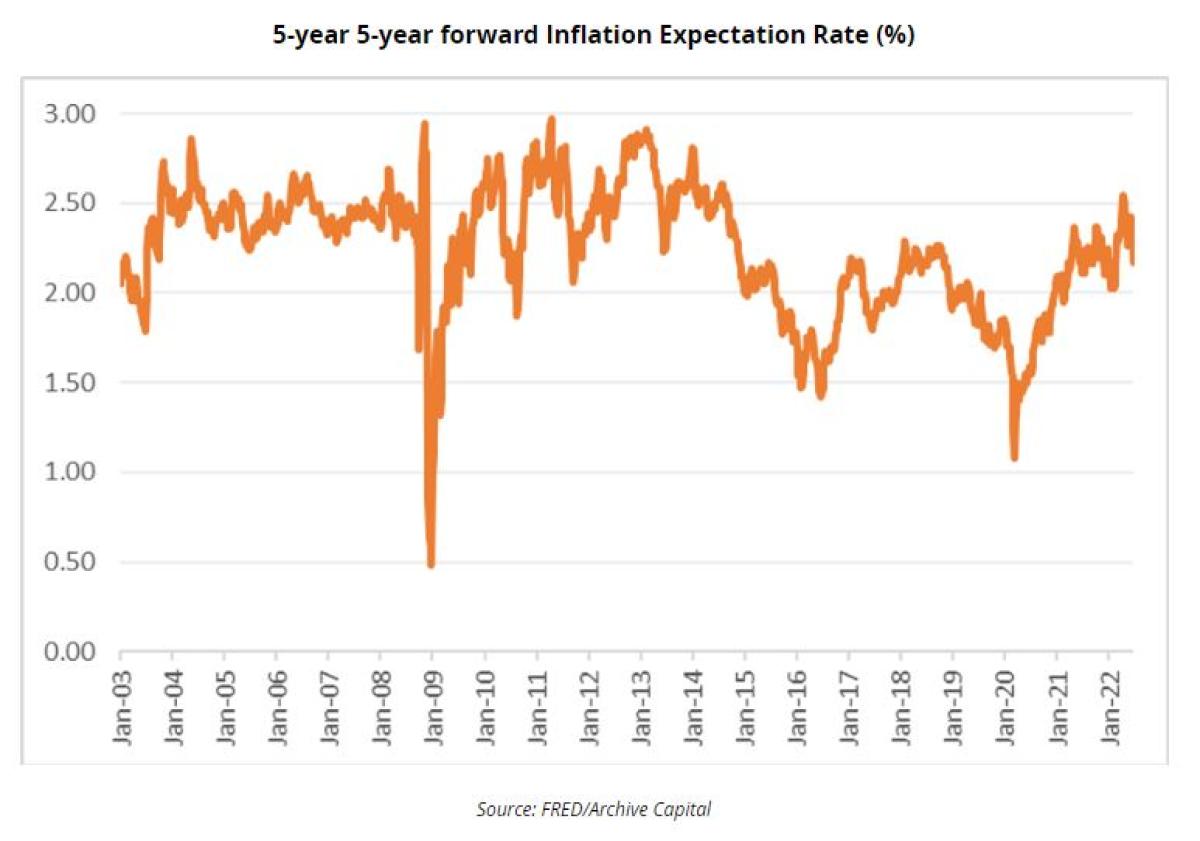
From that perspective it surprising that 5year 5 year forward breakeven rates have fallen of late and remain broadly in the range of the last 20 years. The risk that the Fed accepts a permanent drift higher in inflation over time appears to be underpriced.
Summary
The current challenge facing the Fed of actively slowing the economy to bring inflation down is different to the policy challenges on the 2000s and 2010s and more akin of the policy challenge in the 1960s, 1970s and 1980s.
With a large degree of uncertainty around key macroeconomic relationships and a Fed focused on being “humble and nimble” there is an unusually high importance on the near-term data on growth and inflation rather than projections 2-3 years out.
The Fed can no longer afford to passively respond even if their models suggest that inflation may moderate. That suggests the potential for an overreaction to near term data releases and greater volatility in interest rate markets in particular but more broadly across asset classes.
Such an environment may continue to be favorable macro-orientated strategies and directional strategies like trend following.
The political support for economic pain to reduce inflation may diminish over time and there is a risk of a structural shift higher in the Fed’s inflation tolerance which seems underpriced at the moment.
Check out Alan's Systematic Investor podcast.
About the Author:
Alan Dunne, CEO | Founder of Archive Capital. Alan has worked in the financial markets for over 25 years at global macro and managed futures hedge funds and large investment banks as a CIO, hedge fund allocator, macro strategist, and technical analyst. Prior to founding Archive Capital, he was Managing Director and a member of the investment committee at Abbey Capital.

Alan started his career as a foreign exchange analyst and trader, working for Bank of America in London, Hong Kong, and Singapore and for BNP Paribas in emerging markets before returning to Dublin to join Allied Irish Capital Management, a global macro commodity trading advisor. He was subsequently Investment Director of Royal Bank of Scotland's wealth management business in Ireland where he headed the investment team and was responsible for asset allocation.
Alan is a CFA Charter holder and holds an MSc Investment Management from Hong Kong University of Science and Technology, an MBA from Smurfit Business School, and a BA (Mod) in Economics from Trinity College Dublin.