
By Christoph Junge, CAIA, Head of Alternative Investments at Velliv Pension & Livsforsikring A/S; Denmark’s third-largest commercial pension company.
|
The value of adding alternatives to a portfolio has become clear in a very interesting and unsettling 2022. The invasion in Ukraine, sky-rocketing energy prices, the return of double-digit inflation, Covid-19 still lingering and a positive bond-equity correlation with both bonds and equities being down at the same time meant that investors had not many places to hide.
According to some market commentators, 2022 was the worst year ever for US fixed income. A widely used benchmark for a balanced portfolio consisting of 60 pct. equities and 40 pct. bonds, lost 17,9 pct. in US Dollar terms over the course of the year. European investors most likely experienced a smaller loss, as the Dollar gained close to 6 pct. against the EUR in the same period, depending on the hedging policy.
Adding some alternative investments, like CTA and long-only commodities, added some of the much-needed diversification. But how did more mainstream alternatives like private equity and real estate fare? Well, it’s complicated……
One of the big and much debated surprises of the year was how well some of the unlisted asset classes held up amid tumbling public markets. Is this all about stale pricing and “volatility laundering”? Or is it genuine performance?
Before we dig into the numbers, I want to remind you of a few technical facts of importance.
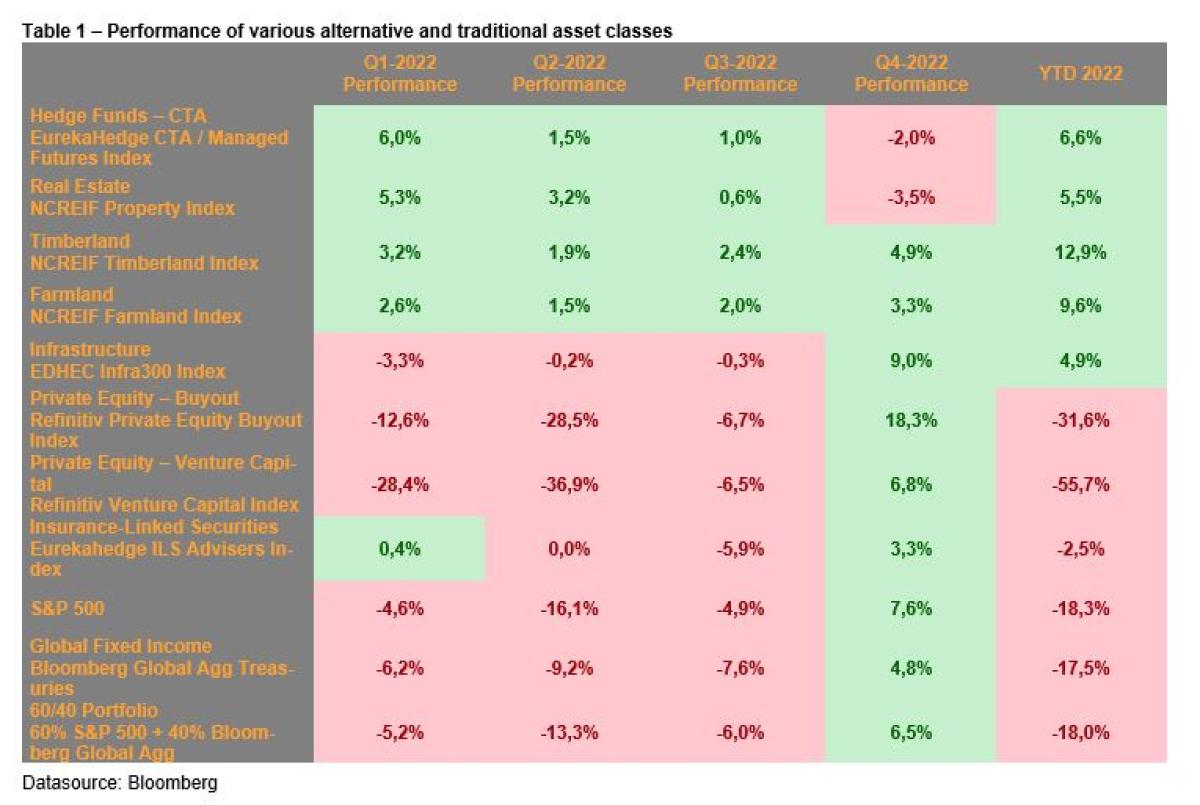
CTA, a sub-asset class from the hedge fund universe that is known for using trend following models, made a huge comeback in 2022 after several years of more lacklustre performance - in fact the best yearly performance on index level since the inception of the SG CTA index 22 years ago. The SG CTA Index was up by 19,1 pct. while the Eurekahedge CTA / Managed Futures Index was up by 6,6 pct., highlighting the huge dispersion in the universe. The index level returns cover over even larger dispersion on manager level, highlighting the importance of manager selection in alternative investments.
The drivers of CTA performance evolved over the course of the year, but in general short positions in fixed income, long positions in energy commodities and long positions in the USD were the major drivers. After very strong trends, especially in the first half of 2022, the CTA universe gave up some of the gains in the fourth quarter as the downtrends in equities and fixed income as well as some currency trends reversed. But even after a soft fourth quarter, the year 2022 was the strongest in the history of the SG CTA index, as mentioned.
That fixed income was a major return driver can be seen in the chart below, where the SG CTA Index is closely following the 10Y US Treasury yield.
SG CTA Index and US Treasury yields were moving together in 2022
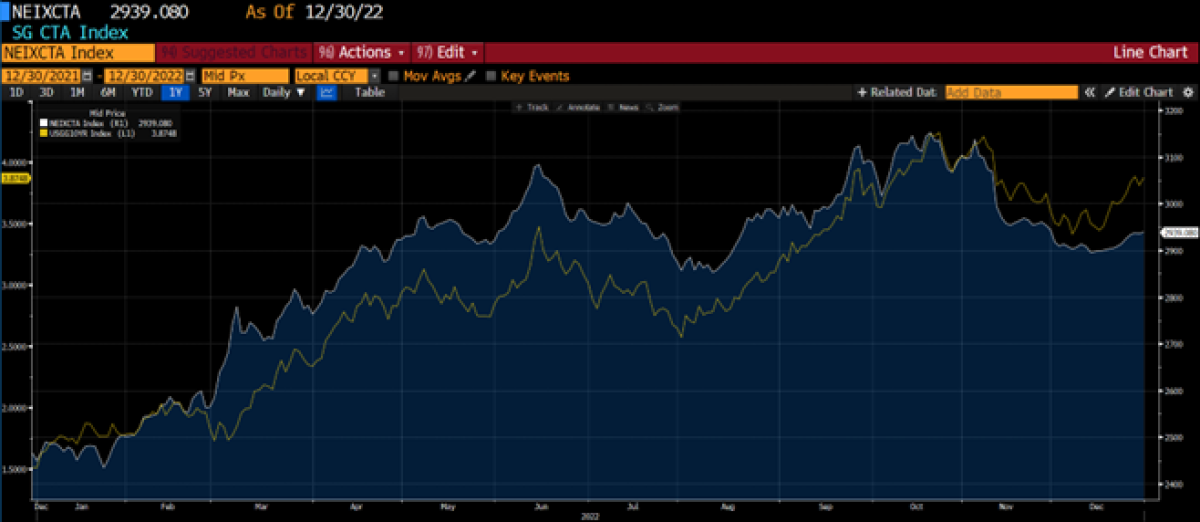
Source: Bloomberg
Investors that are not yet invested in the asset class could ask themselves whether they are “late to the party”, especially since most of the performance was generated during the first 5 to 6 months of 2022 and the recent losses. Could this be a sign of underperformance ahead? AQR, a major player from the quant fund space, have recently published an article where they analyse the performance of trend-following during various historical macroeconomic environments. The key findings are, that the very gentle macro environment during the period 2010 – 2019 to a large degree explains the lackluster performance during this period, while other periods with higher macro volatility also produced the higher performance of trend-following strategies. In addition, they argue, that significant macro volatility tends to persist – meaning that we can expect more macro volatility during 2023, a regime in which trend tends to shine. Finally, they show that there is no tendency for trend-following to underperform following periods of strong performance. All in all, no reason to fear being late to the party, according to AQR.
Real Estate, as represented by the NCREIF Property Index, an unlevered index of directly held properties in the US, slowed down and gave back some of the gains from the first three quarters by losing -3,5 pct. in the fourth quarter, ending the year up 5,5 pct. While office was the canary in the coal mine by being the first sub-sector with losses in the third quarter, all sub sectors but hotels experienced losses. The largest loss came from the office sector with -4,8 pct., while hotels were up by 3,4 pct. Hotels were also the positive contributor in Q3 with 2,70 pct. On a YTD basis, industrial is still the strongest performer with 14,55 pct., followed by hotels with 9,98 pct. Office is the weakest sector with a negative return of -3,37 pct. YTD.
The fourth quarter saw also an uptick in the cap rate (or yield, defined as Net Operating Income / Net Asset Value) for all segments. It’s tempting to say “finally”, given the substantive rise in interest rates. But as I have earlier documented, there is no linear relationship between cap rates and interest rates. It took a long and strong rise in interest rates to finally get cap rates to move (important to note that cap rates also can rise due to higher income, but this time I am quite certain that falling values are at least part of the explanation). The cap rate spread, e.g., the premium above Treasury yields and the green line in the chart below, looks somewhat strained in fx multi-family and industrial. What next? How can the cap rate spread come back to the long-term average? It would either require some solid rent growth, falling interest rates, or falling prices. Or a combination of those. Time will tell.
Cap rates, interest rates, and cap rate spreads 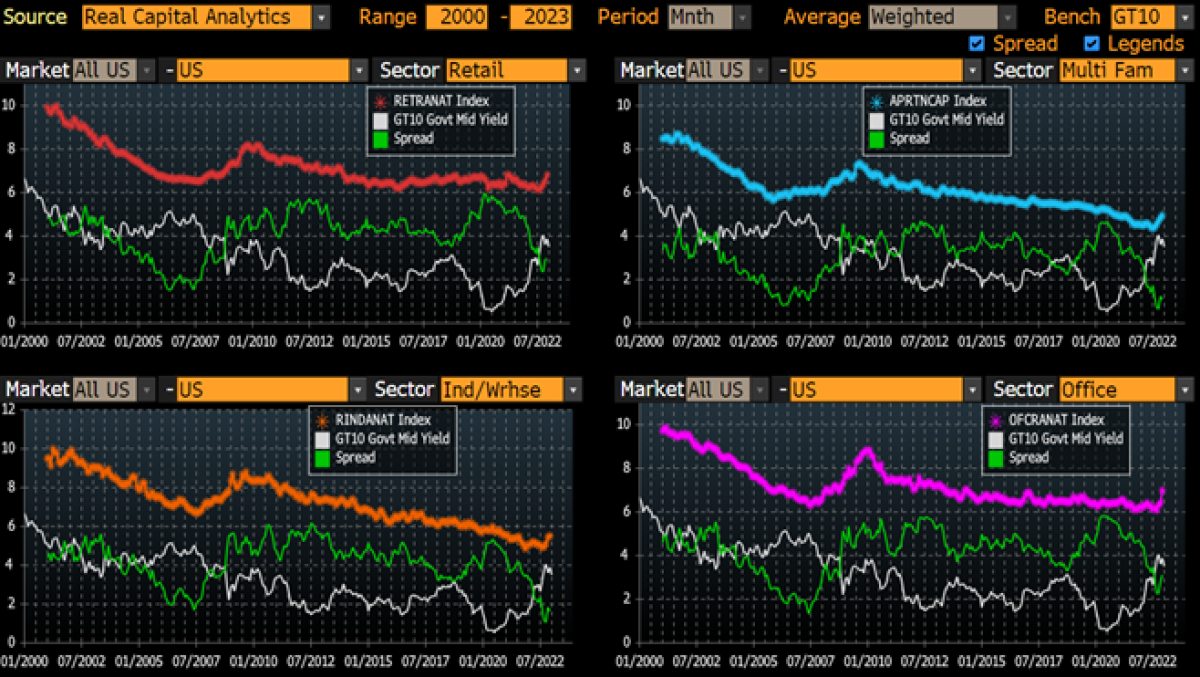
Source: Bloomberg & Real Capital Analytics
Unlisted real estate is often compared with the listed equivalent REITs (real estate investment trusts). This year has so far shown that this is an imperfect proxy as REITs typically operate with a lot of leverage and sometimes also are more opportunistic in nature. This is explained in more detail in these columns on EjendomsWatch and EstateMedia (in Danish).
Even though there might be good reasons for a difference in performance between listed and unlisted real estate, the differences led some investors in unlisted real estate vehicles to redeem their stakes, which in turn activated the gating mechanisms in the funds and hence prevented investors from withdrawing. This happened for the Blackstone Real Estate Income Trust (BREIT) and other open-ended real estate funds and sparked a debate about the sense and nonsense of open-ended funds, where I am in the camp of those seeing a lot of sense in open-ended vehicles.
Both timberland and farmland ended the year with strong returns, posting positive returns of 4,9 pct. and 3,3 pct. respectively in Q4 and are up 12,9 pct. and 9,6 pct. respectively. Timberland and farmland are hence the only asset classes covered in this column that delivered positive returns in all four quarters of this challenging year and thereby living up to their reputation of being a, at least partial, inflation hedge.
Infrastructure, as represented by the EDHEC Infra300 Index, closed the year with a bang. The index was up 9,04 pct. in the 4th quarter, which is most likely driven several factors like a lower equity risk premium as well as stronger cash flow estimates. An interesting point worth mentioning is the fact that the Q1 numbers were revised further up. When the Q1 numbers were originally released during Q2, the estimate was -6,09%. That was later revised up to -3,99% due to updated cash flow forecasts and now to -3,30%. The full-year return ends at +4,92% in a year where both equities and bonds posted heavy losses, which confirms the resilience of infrastructure as an asset class.
From a business model perspective, all types had a strong quarter, but especially the contracted assets were major contributors, standing for approximately half of the returns while regulated and merchant assets contributed approximately equally with app. 4,5 pct. together. Especially the transportation sector with road and airport companies but also independent power producers had another good quarter.
Some (but certainly not all) infrastructure assets profit from an increase in inflation, either through explicit or implicit linkage to CPI, which leads to higher cash flows. And those higher cash flows helped to offset the impact from higher interest rates on the valuations.
Private Equity incl. Venture Capital rebounded together with the stock markets (remember, these are liquid replication benchmarks) and ended the fourth quarter with gains of 18,3 pct. and 6,8 pct., respectively, bringing the calendar year performance to -31,6 pct. and -55,7 pct.
As stated in the beginning of this column, the chosen benchmarks often overstate the movements in the market compared to “real” private equity over shorter time frames. Also, worth mentioning that the reported private equity returns as of 31/12 by institutional investors are, at least if their portfolios consist of PE funds, in fact for the period from Q4 2021 to Q3 2022 (often with adjustment based on movements in public markets) as the quarterly NAV for the end of the fourth quarter are not yet received for most of the funds due to the time lag mentioned in the beginning.
In private equity the year 2022 was really a “tale of two markets” with venture capital getting crushed (do you remember the 85% valuation cut of Klarna earlier this year?) and buyout keeping better up (unlisted buyout, not the liquid replication).
There was quite some debate in the press on whether valuations of private equity – among other asset classes – really are at fair market value amid listed markets being down. I have been quite vocal in that debate and tried to highlight the differences between public and private markets throughout the year. And while far from all private equity funds in our portfolio had positive returns (in fact quite a lot were down), the overall private equity performance was strong. This was driven by only a few funds. Fortunately, those few happened to be some of the largest funds in our portfolio and thus driving the return. And why were they up? First and foremost, due to a very positive development in the underlying portfolio companies. Even though the EV/EBITDA multiples might have fallen, this can be offset by an increase in EBITDA. If the multiple falls from 12x to 11x but the EBITDA growths by 25%, the enterprise value is still up by 14,6 pct.
While some people are arguing that private equity performance is just “volatility laundering”, there are also other pundits arguing that private markets might get it right and that the listed markets are not necessarily perfect at setting the correct price as the frictionless trading invites to knee-jerk reactions. I would also add that trading small fractions of a company at a certain price and using that price to value the whole company can potentially be quite misleading. A perfect showpiece for this thesis is the price development of the company AMTD Digital Inc. The price rose by nearly 14.000 pct. over the course of a few days – to just drop back to the starting point. I doubt that the fundamental value of the company changed so quickly.
Historical price development of AMTD Digital Inc.
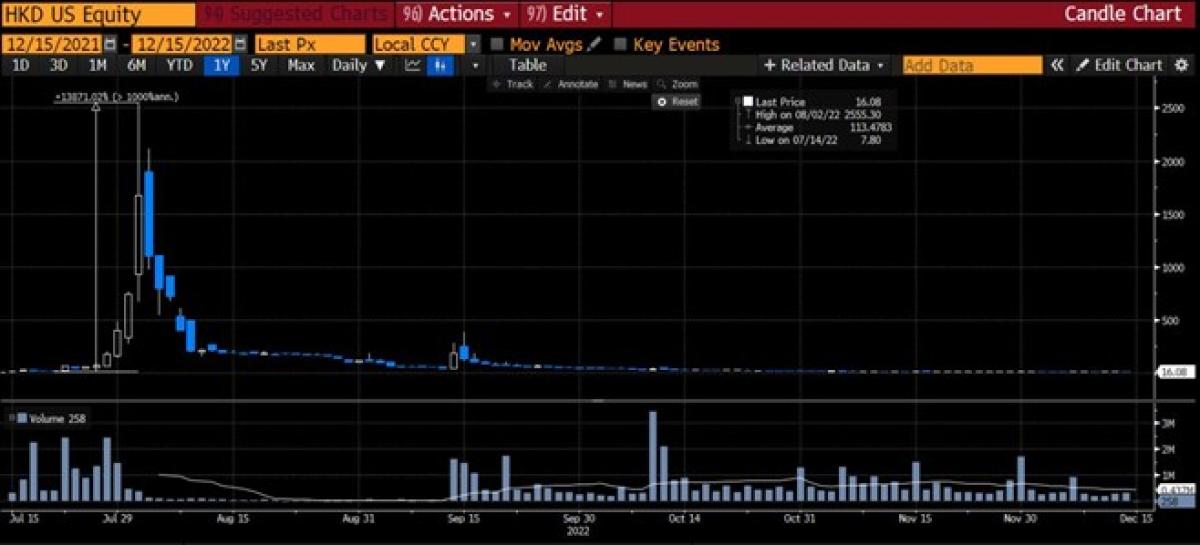
Source: Bloomberg
Or would you have believed in a valuation of 1,2 trillion USD for an electric vehicle manufacturer if it was unlisted? The decline in market cap during 2022 of that said EV manufacturer was roughly 800 billion USD – more than the combined market cap of more or less all of the legacy car manufacturers in the world! Seems to me that public markets are not always setting the correct value of a company.
In private markets, two (or more) professional parties are trading large shares - if not all - of a company based on in-depth due diligence and analysis. I am rather confident that they agree to trade on a fair value. The interim valuations between two trades can be more uncertain, but academic research has shown that interim valuations often tend to be on the conservative side as exits on average happen at 35 pct. above prior mark. This is in line with what we have observed in our portfolio in 2022, as we have seen exits at prices that were above book value, some even substantially above book value.
Exit activity in private equity was also much debated, especially during the second half of the year. Was it falling off a cliff? Activity was down compared to 2021 but still around pre-pandemic levels. While the IPO market disappeared as an exit route, strategic buyers and secondary buyouts (selling to another PE fund) remained strong. Another interesting observation is the exit valuations by deal type. Strategic buyers and secondary buyouts showed more pricing discipline while the public markets during IPOs really paid up during the prior three years. Again, so much for public markets being skilled at capturing fair value.
Summing it up: My best explanation for the divergence between public and private markets in 2022 is that the listed markets were a bit frothy last year while private markets had better pricing discipline and the drop in listed markets is more a sign of reversion to more healthy valuations. Add to that manager skill and you can explain quite a lot. 2023 will be interesting again. Depending on the economic development we could see both a fall in earnings and further multiple contraction which would lead to write-downs of PE funds. On the other hand, there is plenty of dry powder waiting to be deployed which could hold a hand under both valuations and exit activity. If public markets should drop further, I would also expect to see more dry powder in being used for take privates. Either way, expect huge dispersion dependent on manager skill, sector & vintage allocation going forward.
Insurance-Linked Securities (ILS), often also referred to as “CAT Bonds” (catastrophe bonds), had a strong fourth quarter with positive returns of 3,25 pct., which was characterised by a rebound after the very negative third quarter due to Hurricane Ian, as some of the loss estimates seem to have been too large. Ian was a large, complex, and destructive category 4 hurricane and was the deadliest hurricane since the 1935 Labor Day hurricane. The asset class ends the year with a total loss of 2,52 pct.
The floating rate nature of ILS shielded investors during the first half of 2022 from losses when rates went through the roof. Even the tumbling equity markets had little effect on the ILS market, which reinforced the reputation of being a totally uncorrelated asset class.
Going into 2023, the market is characterized by the biggest pricing reset since hurricane Katrina in 2005, with premiums rising 85% on average. This is driven by a lack of capital in the market, caused by losses in the recent years and the very strong dollar. According to Twelve Capital, an ILS manager, the current market offers one of the best entry points for investors in decades.
Conclusion: 2022 showed the value of adding alternatives to a portfolio and debunked the myth that rising rates per se are negative for all types of investments as higher cash flows can offset the impact from higher discount rates – at least until a certain point as seen during Q4 in real estate. The other parts from the real asset universe (timber and farmland) were a more efficient inflation hedge than real estate and coped well with rising rates – so far. Some pundits argue that higher rates will dampen the appetite for alternatives as fixed income becomes more attractive again. While I won’t argue against the fact that fixed income has become more attractive now with higher yields, last year also showed that fixed income can have nasty tail risks – maybe more than expected. And higher risk justifies smaller allocations. In addition, alternatives have shown that they are not just illiquid equity and bond beta but can add value beyond and have hence a place in a portfolio even in a higher rate environment.
2022 was also a year where there was increased focus on the valuations of unlisted assets. While I, in general, agree that there shouldn’t be a difference between two identical assets – whether they are listed and unlisted – there are in fact differences and no two assets are absolutely identical. Private market investments are much more complex than just taking public market performance adjusted for beta. Private markets seem also to be less prone to irrational exuberance than public markets. So the drop in valuations in the listed markets that we witnessed in 2022 could in fact really just be a return to normality after the irrational exuberance of 2021.
The positive correlations between equities and bonds made this year challenging and not easy to navigate for investors. Long-only investors have not had many places to hide. But the ability to take long/short positions helped CTA tremendously, especially being short bonds in an environment of rising interest rates. ILS, which are normally a good diversifier due to their uncorrelated nature, had losses as well, but of course driven by other factors than rising rates or falling equities. Timberland and farmland confirmed their inflation hedging capabilities and infrastructure its defensive traits.
While earnings in many companies were strong in 2022, it will be crucial how earnings develop in 2023. The strong earnings held a hand under the valuations of privately owned companies in 2022. If the US and Europe end up in a recession (which would be the most anticipated recession in history) and earnings would drop, we would most likely experience more write-downs in private equity funds.
While cheap beta products often were superior during the QE days, active management (not only in alternatives) could really be up for a renaissance with more challenging markets ahead. The more volatile the markets and the more complex the area, the larger the dispersion between good and bad managers in the years to come. |
About the Author:
Christoph Junge is Head of Alternative Investments at Velliv; Denmark’s third-largest commercial pension company. He is a Chartered Alternative Investment Analyst and has more than 20 years of experience from the financial industry in both Denmark and Germany. He has worked with Asset Allocation, Manager Selection as well as investment advice in, among others, Nordea, Tryg and Jyske Bank.